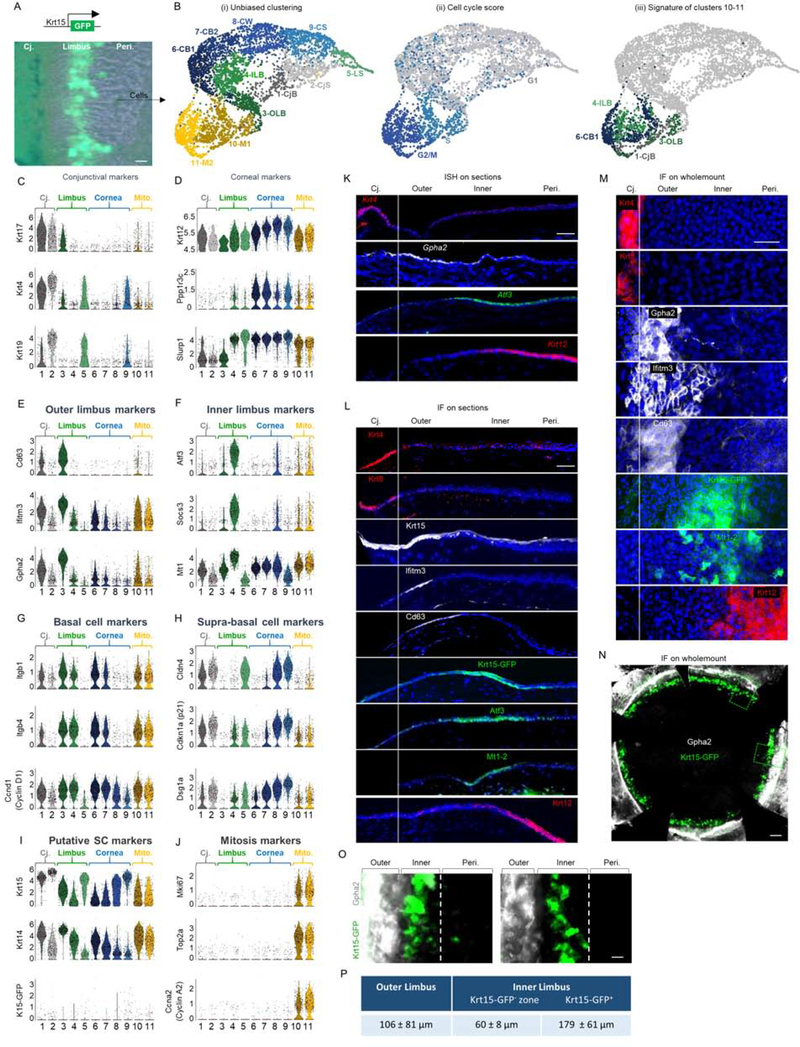
Figure 1: scRNA-seq reveals corneal epithelial cell states including 2 distinct basal limbal epithelial cell populations.
(A-B) The limbus (with marginal conjunctiva and cornea) of 10 corneas of 2.5-month old Krt15-GFP transgenic mice was dissected, pooled and epithelial cells were subjected to scRNA-seq analysis. (B) UMAP plots presentations of (i) Unbiased clustering revealed 11 distinct groups of cells. (ii) Cell cycle score analysis revealed that most cells in clusters 10–11 display the signature of cells captured in specific stages of mitosis. (iii) Cell type classification for clusters 10–11 shows they consist of a mixture of cells with a hallmark of different ocular basal cells. (C-J) Violin plots of differentially expressed markers in each cluster. Y-axis in C-J represents expression level. (K-O) In situ hybridization (ISH) (K) or immunofluorescent staining (IF) on tissue sections (L) or wholemount (M-O) of 2-month-old mice for the indicated markers. (P) Analysis of the width (mean ± standard deviation) of limbal sub-compartments. n=3 corneas. Scale bars were 50 μm (A-M, O-P) or 300 μm (N). Nuclei were counter stained by DAPI. Abbreviations: Cj., conjunctiva; Mito., mitosis; Peri., periphery; CjB, conjunctival basal; CjS, conjunctival suprabasal; OLB, outer limbal basal; ILB, inner limbal basal; LS, limbal superficial; CB1, corneal basal 1; CB2, corneal basal 2; CW, corneal wing; CS, corneal superficial, M1/M2, cells in mitosis.
See also Figures S1, S2, and S3.

