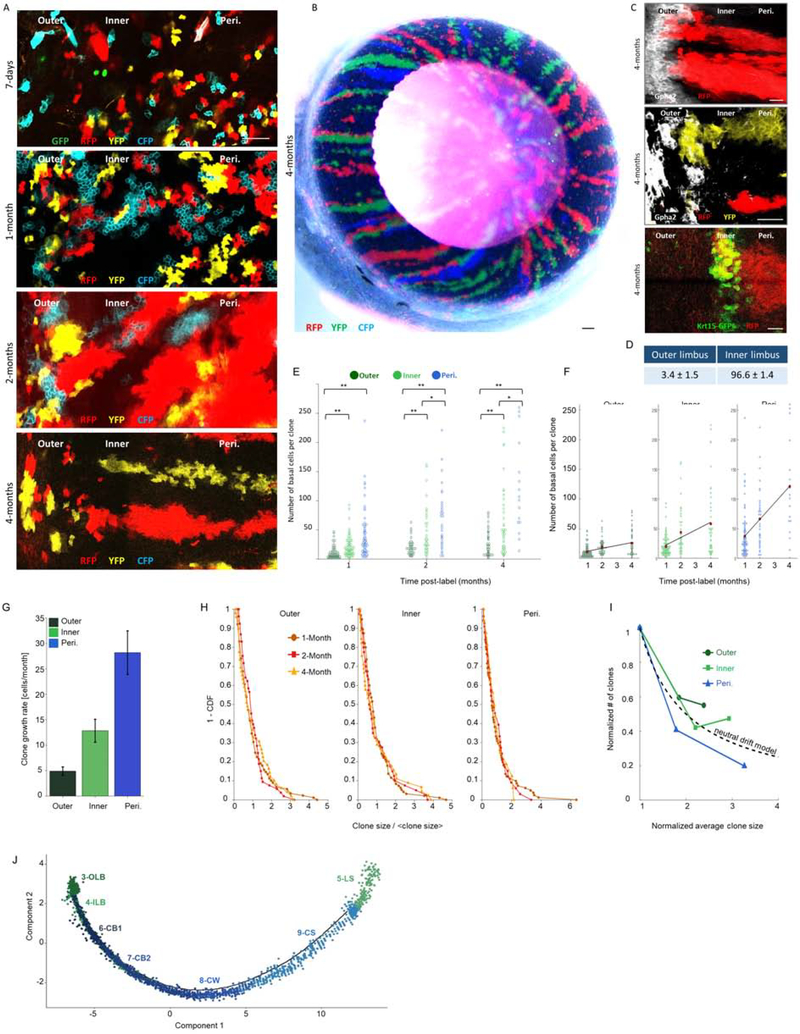
Fig 2: Quantitative “Confetti” lineage tracing unravels the dynamics of outer and inner LSCs.
Lineage tracing was induced by tamoxifen injection in 2-month-old UBC-CreERT2; Brainbow2.1“Confetti” mice (see Fig. S4B–C). Confetti-positive clones were analyzed at the indicated time points post-induction. Typical tile sean confocal images of the limbal zones are shown in (A, C) and the entire eye (cornea view) is shown in (B). The same pictures shown here in A, are also shown in Fig. S4D together with Gpha2 co-staining. (D) The percentage of stripes that emerged from the outer or inner limbus. (E-F) A Scatter plot of clone size distributions shows the indicated regions over time (E) or across the different time points for the different colonial regions (F). Red dots denote the average clone size and the black line indicates the linear model that fits the data. (G) The clonal effective growth rate, as estimated from the linear fit. Error bars are 95% confidence interval (CI). Note that the 95% CI do not overlap. (H) One minus the cumulative distribution function of the clone size divided by the mean clone size. The scaled distributions collapse onto the same curve (compare to Fig. S4G, which shows the non-scaled distributions). (I) The normalized number of clones as a function of normalized clone size. The dotted line denotes the inverse relation between clone size and clone number as expected from the neutral drift model. (J) Pseudotime plot predicts the differentiation process across clusters. Scale bars are 100 μm (A, C) and 50 μm for (B). n=15 areas from 3–5 corneas of 3 individuals. Statistical significance was calculated using the Kolmogorov-Smirnov test. (*, p-value < 0.05; ** p-value <0.005). Abbreviations: Peri., Periphery; OLB, outer limbal basal; ILB, inner limbal basal; LS, limbal superficial; CB1, corneal basal 1; CB2, corneal basal 2; CW, corneal wing; CS, corneal superficial.
See also Figure S4.

