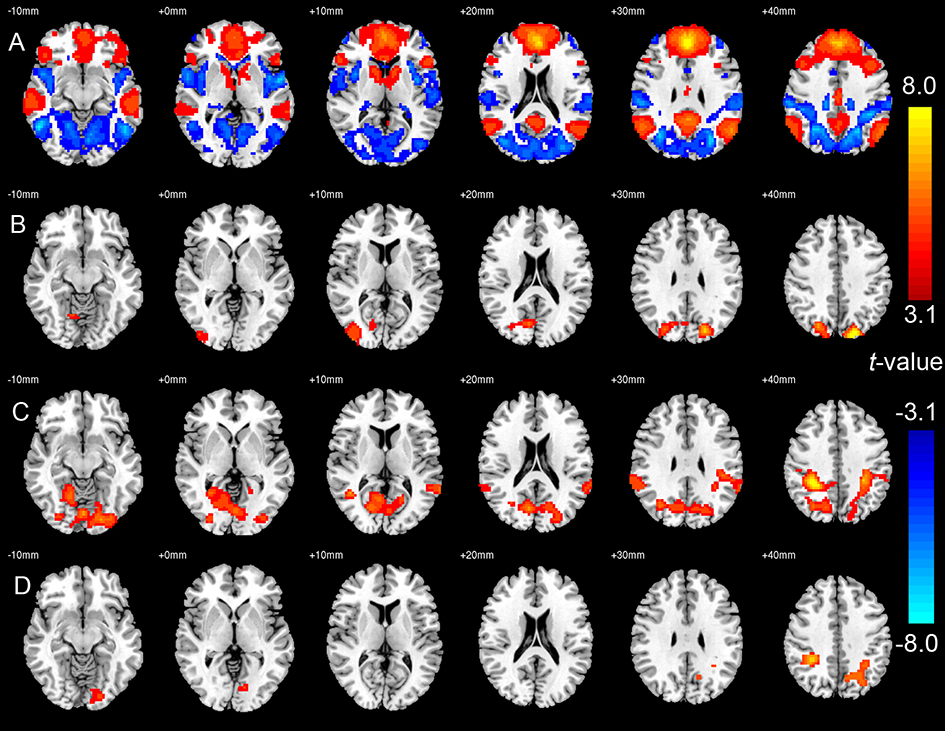
Figure 1:
(A) Default mode network and the anticorrelated task-positive network in healthy controls (HC), indicated by cold and warm colors respectively. (B) Areas with decreased anti-correlation with medial prefrontal cortex (MPFC) in bipolar disorder (BD, n=39) compared to HC (n=29). (C) Areas with decreased anti-correlation with MPFC in schizophrenia (SZ, n=27) compared to HC (n=29). (D) Areas with decreased anti-correlation with MPFC in SZ (n=27) compared to BD (n=39). In all figures, threshold was set to FDR corrected p<0.05. In the plot of (B) to (D), the differences were indicated by the warm colors. Images are shown in radiological convention with left side of the brain displayed on the right side of the image.

