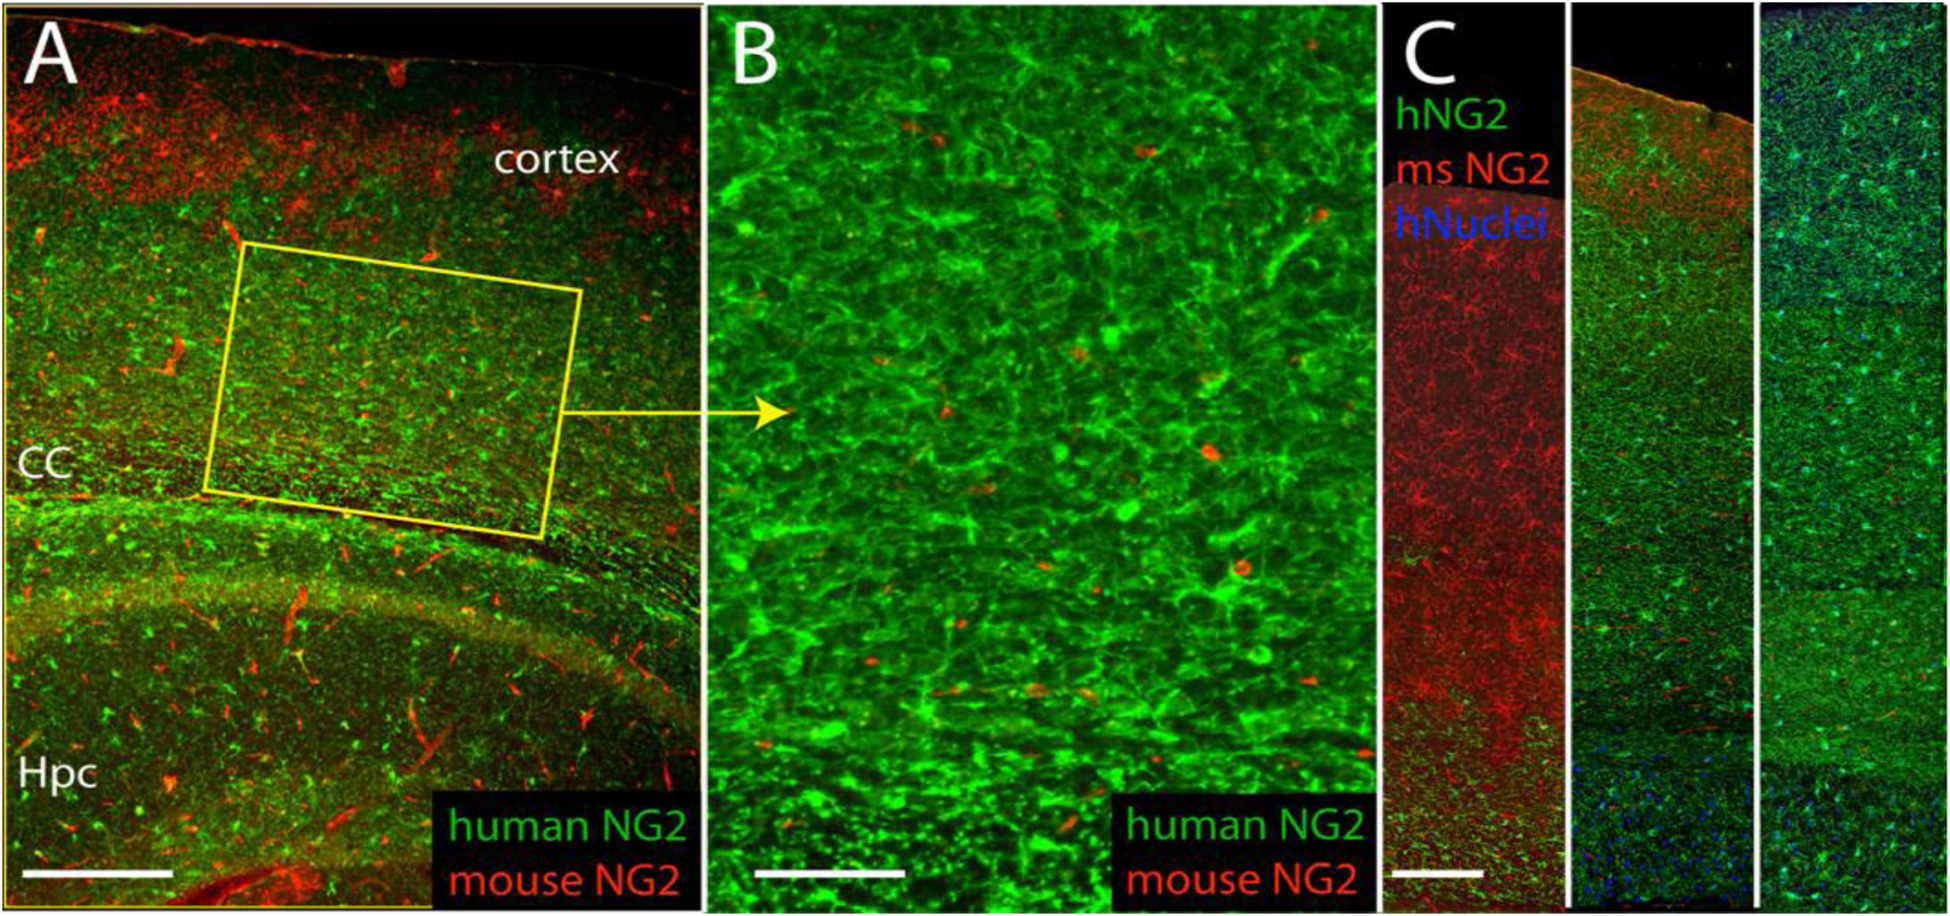
Figure 2. Human glial progenitor cells colonize and then dominate human glial-chimeric mouse brains.

A. 9-month old mouse engrafted neonatally with human GPCs, shows predominance of human GPCs over time. Human-specific NG2, green; mouse NG2, red. B. Higher power of A, showing dense engraftment of human GPCs. C. Cortical strips show progressive dominance of human GPCs (green) relative to mouse (red) at 3 (left), 9 (center) and 13 (right) months after neonatal engraftment.
Scales: A, 400 μm; B, 100 μm; C, 150 μm. Adapted from (Windrem et al., 2014).
