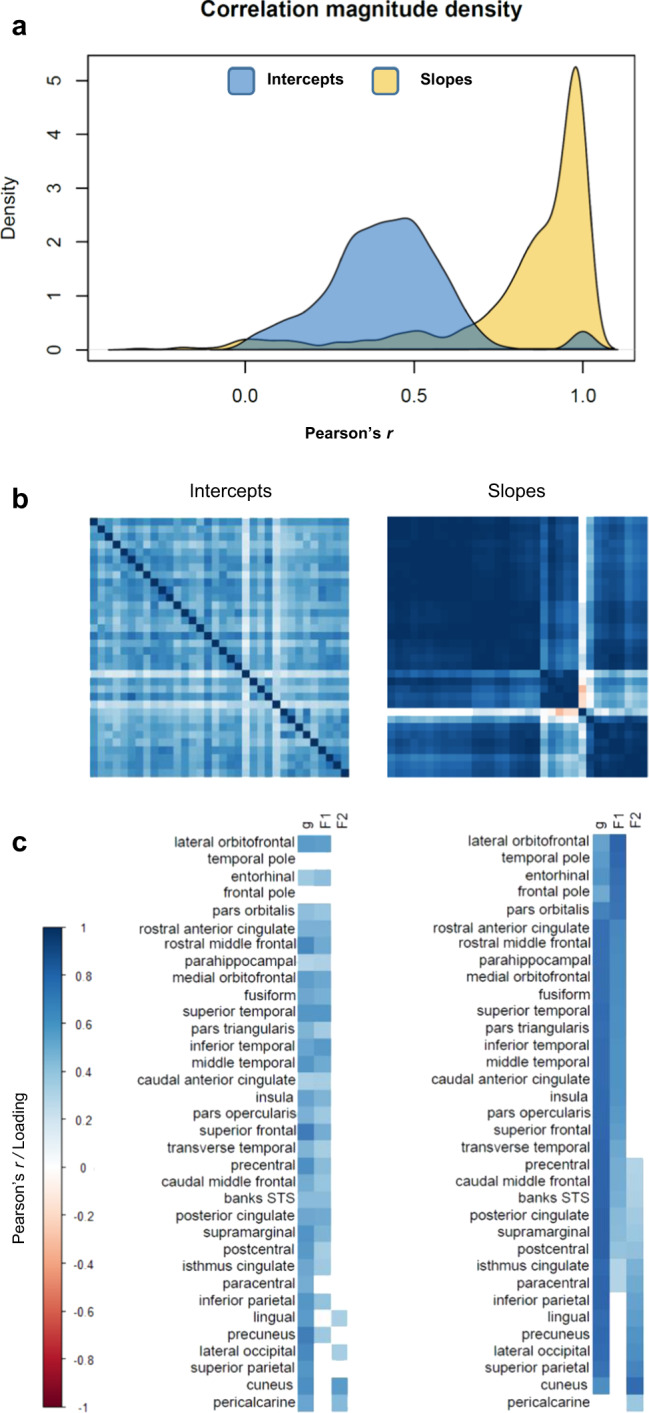
Fig. 3. Correlation matrices and exploratory factor loadings for ROI intercepts and slopes, estimated using left–right average values for ROIs.

Exploratory factor analyses. a Density plots of the correlation magnitudes among freely estimated intercepts and slopes; b heatmaps of the correlations among freely estimated latent intercepts (left) and slopes (right), intercept axes are fixed according to the hierarchically clustered slope matrix; c loadings of each ROI’s intercept and slope on a general factor of cortical change (g) and on two additional factors identified from an exploratory Schmid–Leiman factor analysis, conducted on the same latent correlation matrices as shown in (b). Loadings reported in Supplementary Table 9. Factor F1 pertains to fronto-temporal, and F2 to occipito-parietal regions.
