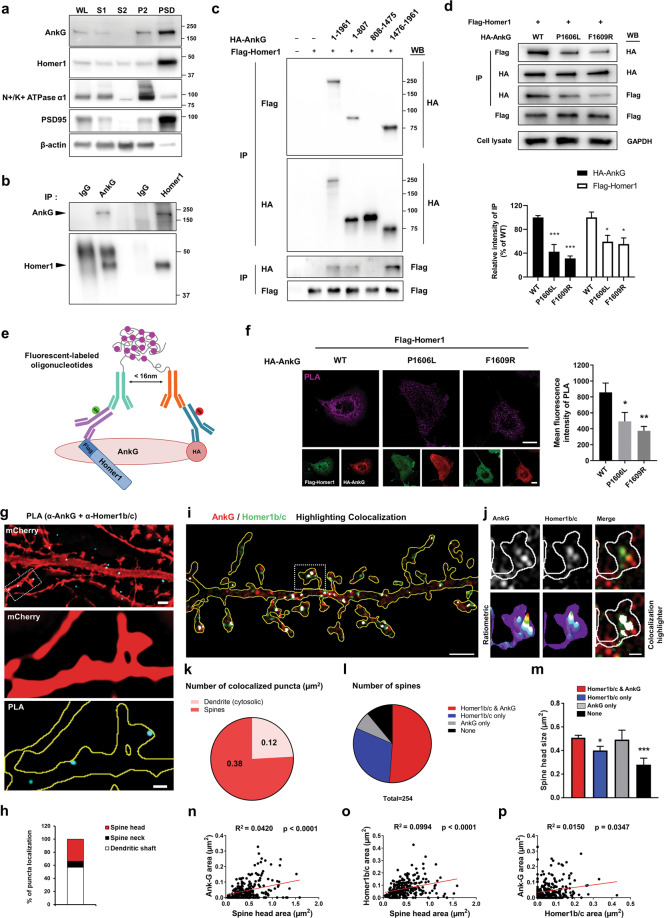
Fig. 2. Ankyrin-G 190 and Homer1b/c interaction in nanodomains within dendrites and spines.
a Western blot of subcellular fractionation from 16-week-old mouse cortex is probed with ankyrin-G, Homer1b/c, N+/K+ ATPase α1 (as a plasma membrane marker), PSD-95 (as a postsynaptic marker), and β-actin antibodies. Each lane was loaded with 10 µg of each sample. WL whole cell lysate, S1 cytosol/membranes, S2 cytosol, P2 crude synaptosomes, PSD PSD-enriched synaptosomal fraction. b Co-immunoprecipitation experiments with anti-ankyrin-G or anti-Homer1b/c from the PSD-enriched synaptosomal fraction. IgG control IgG, IP immunoprecipitation. c Binding of ankyrin-G and its truncation mutants to Homer1c. The top panel shows the immunoprecipitated full-length ankyrin-G or the truncated versions of ankyrin-G co-expressed with Homer1c. d Effects of point mutations in the PPXXF Homer-binding motif of ankyrin-G (P1606L and F1609R) on the interaction with Homer1c. The HEK293T cell lysate was analyzed by immunoblotting with HA or Flag antibody. n = 4 per each group. F(2, 9) = 24.10; F(2, 9) = 6.17; *p < 0.05, ***p < 0.001; followed by one-way ANOVA followed by a Bonferroni test. Data are represented as mean ± SEM. e Schematic representation for the in situ proximity ligation assay (PLA). f Confocal images for detection of the interaction between HA-ankyrin-G wild-type (WT) or point mutants (red) and Flag-Homer1c (green) with PLA (magenta) in COS7 cells. Scale bar, 20 µm (top and bottom). Bar graph of the PLA signal with the mutants of HA-ankyrin-G and Flag-Homer1c. n = 13 per each group. F(2, 36) = 6.48; *p < 0.05, **p < 0.01; one-way ANOVA followed by a Bonferroni test. Data are represented as mean ± SEM. g SIM image of a mCherry-expressing neuron to detect the interaction between ankyrin-G and Homer1b/c by PLA (cyan). Scale bar, 2 µm (top panel). Zoomed images were shown from the boxed area in the top panel. Scale bar, 0.5 µm (middle and botton panels). h Bar graph showing the PLA puncta ratio in spines versus dendrites, n = 9 cells. i SIM image of mCherry-expressing neurons immunostained for anti-ankyrin-G (red) and anti-Homer1b/c (green). Scale bar, 2 µm. Colocalization is shown in white by ‘colocalization highlighter’ in ImageJ. j High-resolution image of boxed spine in i. Bottom panels: ratiometric images and colocalization (white). Scale bar, 0.5 µm. k Pie chart showing the highlighted puncta ratio of spines versus dendrites per spine area. l Pie chart of expression patterns of ankyrin-G and Homer1b/c in spines. m Spine head size from the chart (k) was analyzed with a bar graph. F(3, 250) = 5.77; *p < 0.05, ***p < 0.001; one-way ANOVA followed by a Bonferroni test. Data are represented as mean ± SEM. Correlation plot of the size of anti-ankyrin-G (n) or anti-Homer1b/c (o) nanodomains versus spine head area, and the size of anti-ankyrin-G versus anti-Homer1b/c nanodomains (p). n = 13 cells. Head area: 0.452 ± 0.017 µm2; anti-ankyrin-G nanodomain area: 0.032 ± 0.002 µm2; anti-Homer1b/c area: 0.056 ± 0.003 µm2.

