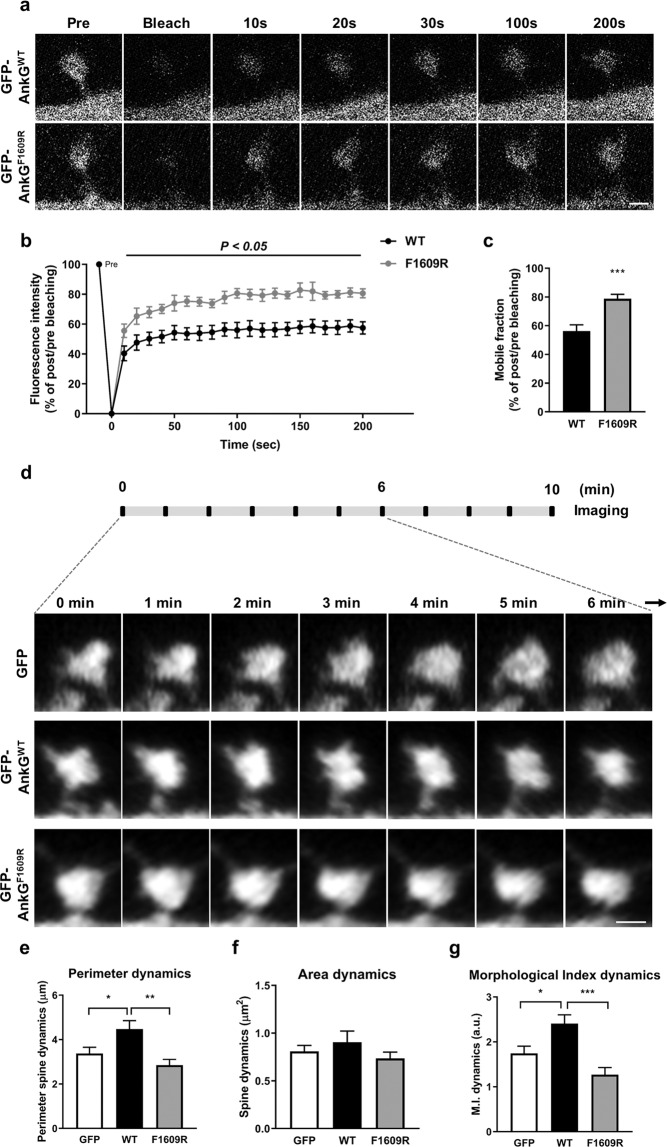
Fig. 4. Mutation of the PPXXF binding motif in ankyrin-G 190 increases its mobile fraction in spines and reduces spine head dynamics.
a Representative time-lapse of fluorescence recovery in a FRAP experiment in neurons overexpressing GFP-ankyrin-G 190 WT or F1609R. Scale bar, 1 µm. b Quantification of GFP-ankyrin-G or mutant fluorescence intensity in each spine every 10 s for 200 s. F(20, 126) = 19.32; two-way ANOVA followed by a Bonferroni test. Data are represented as mean ± SEM. c The graph of the mobile fraction (% of post per pre bleaching at 200 s) in GFP-ankyrin-GWT and GFP-ankyrin-GF1609R-overexpressing neurons (n = 7 cells per each group, 3–5 spines from a neuron on three independent experiments). t(12) = 4.24; ***p < 0.001; two-tailed Student’s ttest was performed. d Time-lapse imaging of spine head dynamics. Neurons were co-transfected with tdTomato together with GFP, GFP-ankyrin-GWT or GFP-ankyrin-GF1069R and imaged for 10 min. Seven representative images from 0 to 6 min taken at different time points were shown. e Analysis of perimeter dynamics from spine head. F(2, 48) = 7.28. f Quantification of area dynamics from spine head area. F(2, 48) = 1.05. g Spine morphological index (M.I. = P2/4πA) dynamics in 10 min from spines. F(2, 48) = 11.22. GFP: n = 17 spines, GFP-ankyrin-GWT: n = 16 spines, GFP-ankyrin-GF1069R: n = 18 spines; all spines were measured from 9 neurons per each group on four independent experiments. *p < 0.05; **p < 0.01; ***p < 0.001; one-way ANOVA followed by a Bonferroni test. Data are represented as mean ± SEM. See also Movie 1.

