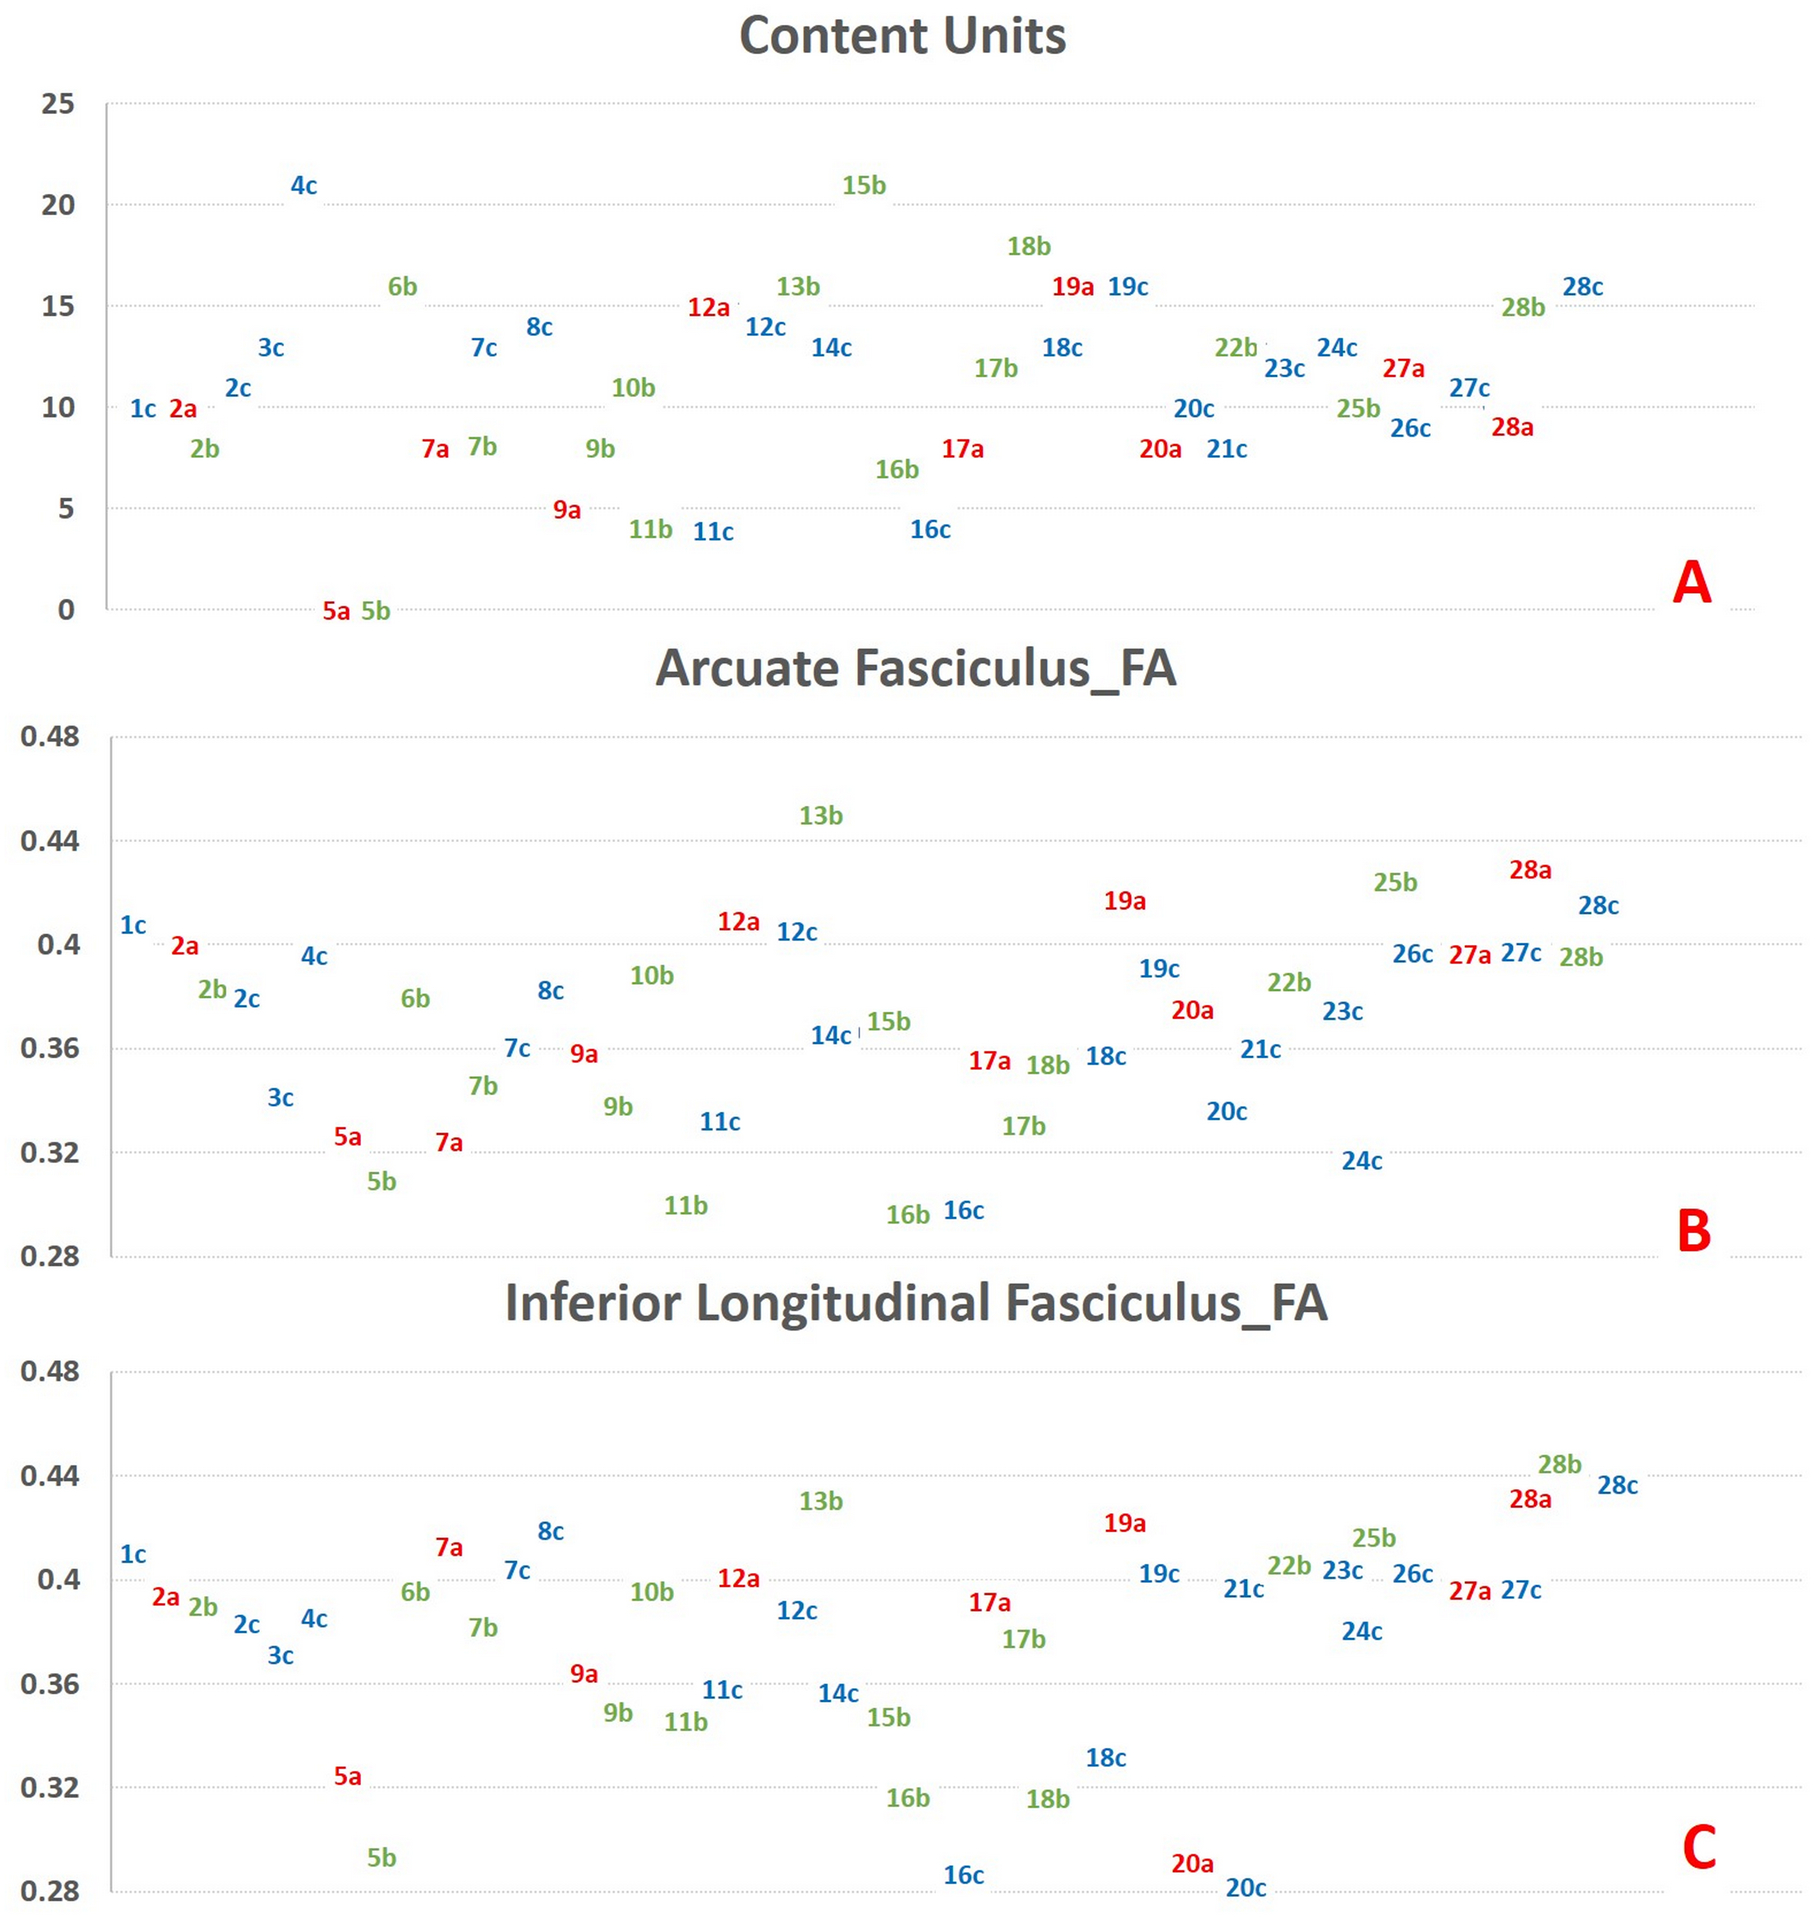
Figure 2.

Scatter plots of all the data points (a: acute/subacute (colored in red), b: early chronic (colored in green), c: late chronic (colored in blue) from each subject (named numerically and combined with time point; e.g. “1c” represents late chronic time point from subject 1) for correct content (CU), fractional anisotropy (FA) of the left arcuate fasciculus, and the inferior longitudinal fasciculus are highlighted. Y-axis represents content units (CUs) in figure A, FA values for figures B and C. Data labels correspond to the data points in the Y-axis. Although there are no validated cut-off values to classify post-stroke aphasias under mild, moderate, or severe categories, higher CUs represent better outcomes. There was no consistent trend of increase or decrease in behavioral or imaging metrics across the time points for the patients who have more than one data point.
