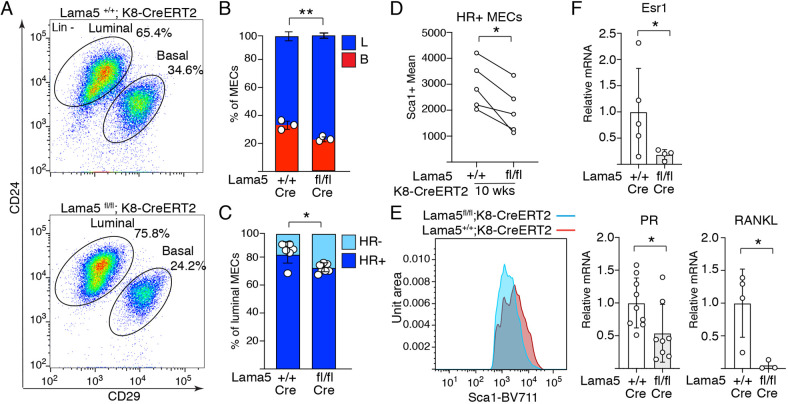
Fig. 3.
Laminin α5 is needed for HR+ luminal epithelial cell identity. (A) Representative CD24/CD29 FACS plot showing relative amounts of lineage marker negative luminal and basal MECs from 10-week-old Lama5fl/fl;K8-CreERT2 and control animals. Gating strategy for the same sample is shown in Fig. S3A. (B,C) Quantification of the percentages of basal and luminal MECs (+/+, n=3; fl/fl, n=3 individuals analyzed) and (C) luminal HR+ and HR− subpopulations from 10-week-old Lama5fl/fl;K8-CreERT2 and control mice (+/+, n=6; fl/fl, n=6 individuals analyzed). Data points indicate samples analyzed from individual mice. (D) Mean intensity of Sca1+ luminal population from Lama5fl/fl;K8-CreERT2 and control mice. Data show mean from n=5 separate experiments, in which 3-4 individual animals were analyzed per group. Data points indicate mean values from five separate experiments. (E) Representative Sca1-BV711 histograms of individual Lama5+/+;K8-CreERT2 and Lama5fl/fl;K8-CreERT2 mice. (F) qRT-PCR analysis of Esr1, PR and RANKL expression compared with GAPDH in luminal MECs from 10-week-old Lama5fl/fl;K8-CreERT2 and control mice (Esr1 +/+, n=5; fl/fl, n=4; PR +/+, n=9; fl/fl, n=8; RANKL +/+, n=4; fl/fl, n=3). Data points indicate samples analyzed from individual mice. Data are mean±s.d. *P<0.05, **P<0.01 [unpaired two-tailed Student's t-test (B,C,F); paired t-test (D)].

