Fig. 4.
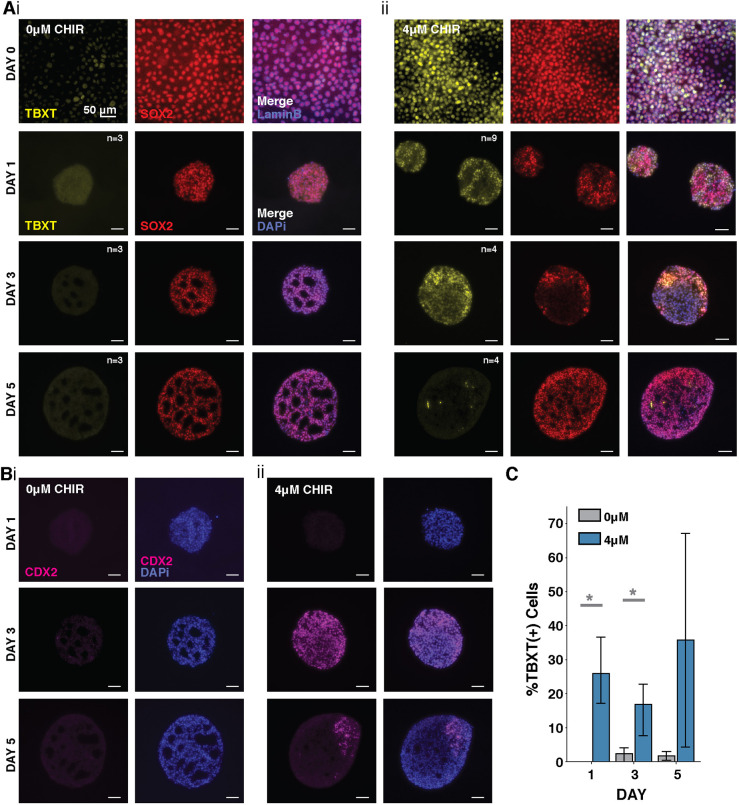
Emergence of TBXT, SOX2 and CDX2 over time in 4 μM CHIR organoids. (A) Fluorescence images of histological sections of cultures exposed to (i) 0 μM CHIR and (ii) 4 μM CHIR before and after aggregation showing increases in TBXT+SOX2+ cells with CHIR treatment. (B) Fluorescence images of histological sections of cultures exposed to (i) 0 and (ii) 4 μM CHIR showing CDX2 emergence and localization over time. (C) Quantification of TBXT loss in fluorescence images (n>3 per day, *P=0.04; data are mean±s.e.m.).

