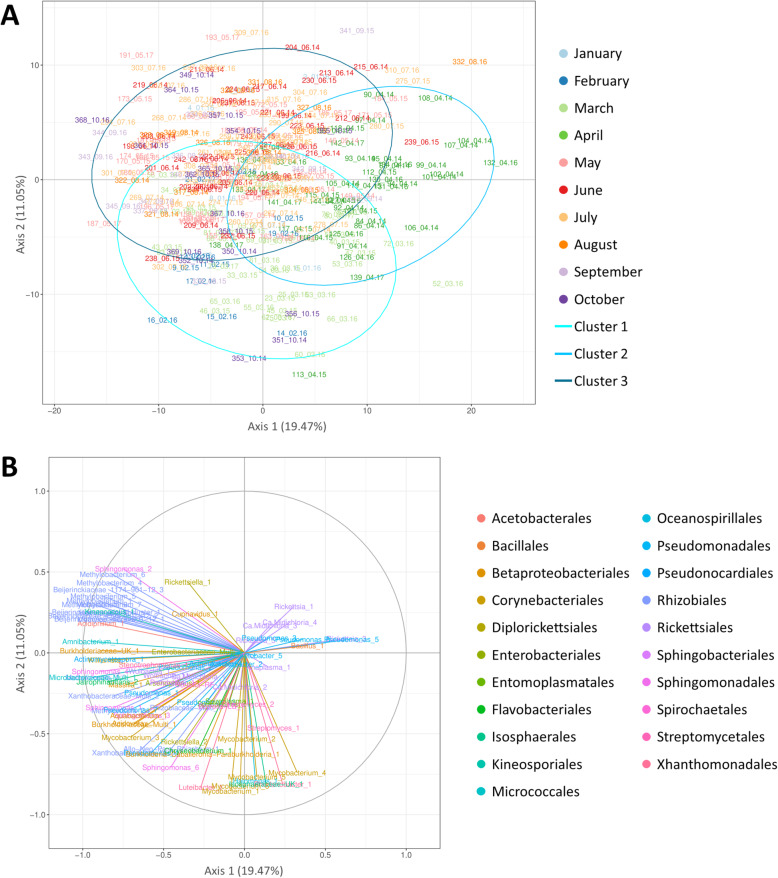
Fig. 3.
Principal component analysis performed on the dataset excluding Wolbachia and Arsenophonus-positive samples. Presented according to axes 1 (19.47%) and 2 (11.05%). A Sample projection of the PCA. Samples are colored according to the month of tick sampling. Plotted samples are named as following: ID_Month.Year. Cluster 1 ellipse correspond to ticks sampled in February–March, Cluster 2 ellipse correspond to ticks sampled in April and Cluster 3 ellipse correspond to ticks sampled from May to September. B Correlation circle of the PCA. OTUs are colored by taxonomic order

