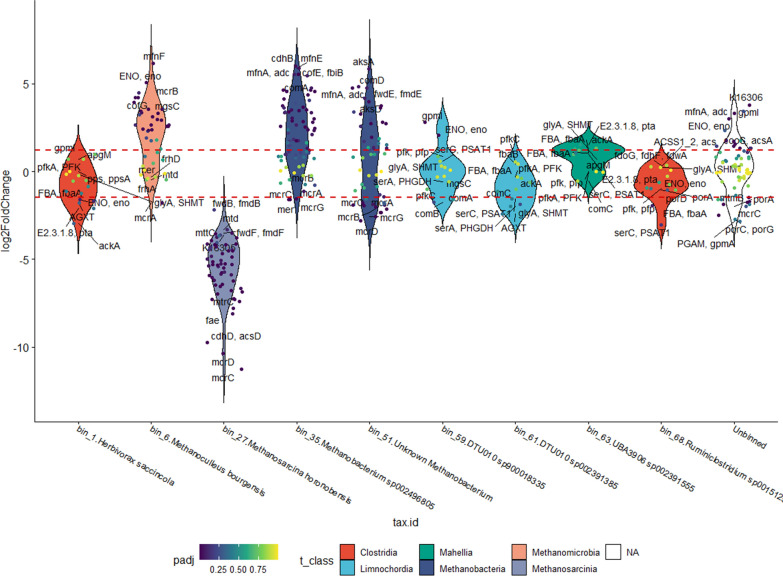
Fig. 4.
Violin plot of genes (small dots) involved in the methanogenesis KEGG pathway (map00680) in each bin (arranged on the X-axis) and the unbinned gene collection. Only bins, which contain at least are plotted. Filling colors indicate taxonomy at Class level. Each dot represents a KEGG 5 methanogenesis genes orthologue (KO) in the respective bin. Colors of the dots indicate the p-value of the log2FC difference between N2_MTR and H2_MTR samples. Horizontal dashed red lines mark the log2FC thresholds for significantly different KOs (respective p-value < 0.05)

