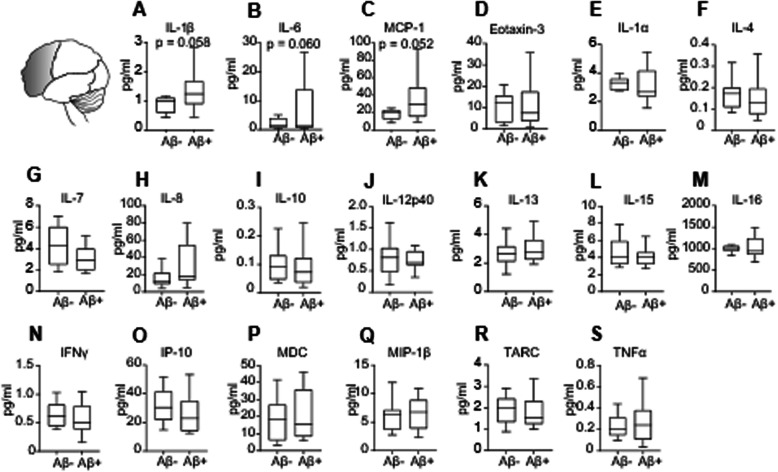
Fig. 5.
Increased cytokine expression in the frontal cortex of Aβ+ individuals. Cytokine expression assessed by multispot immunoassays revealed a trend towards increased levels of a IL-1β, two-tailed Student t test; t (17) = 2.028, p = 0.058; Aβ−, n = 9; Aβ+, n = 10; b IL-6, two-tailed Student t test; t (22) = 1.981, p = 0.06; Aβ−, n = 11; Aβ+, n = 13; and c MCP-1, two-tailed Student t test; t (19) = 2.067, p = 0.052; Aβ−, n = 9; Aβ+, n = 12, in the frontal cortex of non-demented individuals with Aβ deposition as compared with individuals without Aβ deposition in this brain region. d–s Expression cytokine levels did not differ between Aβ− and Aβ+ individuals (Eotaxin-3, IL-1α, IL-4, IL-7, IL-8, IL-10, IL-12p40, IL-13, IL-15, IL-16, IFNγ, IP-10, MDC, MIP-1β, TARC, and TNFα). Data are displayed in boxplots where the median is represented by the horizontal line and the whiskers represent the 25th and 75th percentiles

