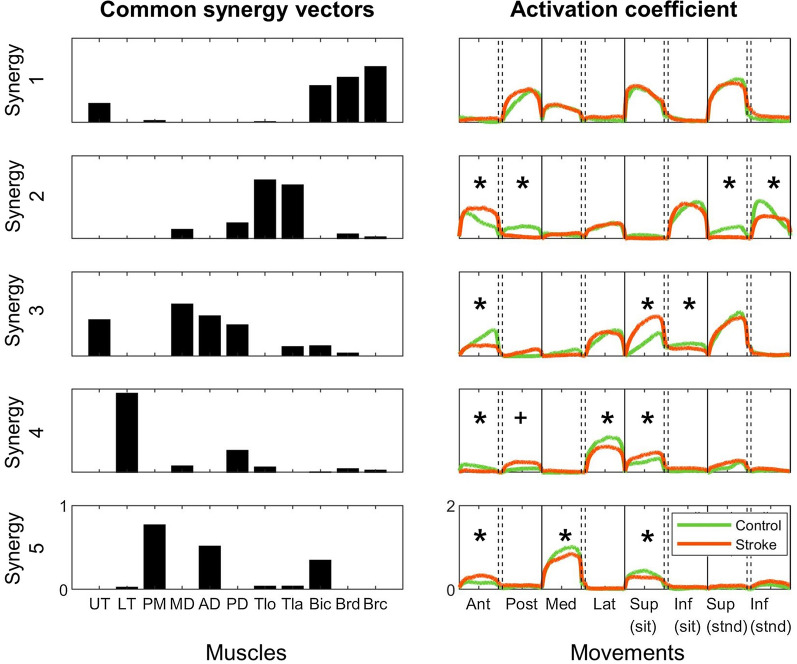
Fig. 5.
Common synergy vectors (left) and their activation coefficients (right). Activation coefficients of the common synergy vectors were compared between the stroke survivors (orange) and the control participants (green). Asterisks represent the statistically significant difference in the activation coefficient between the groups (Wilcoxon rank-sum test, p < 0.05). A cross implies the difference in which statistical significance was marginal (p = 0.05). Ant anterior movement, Post posterior movement, Med medial movement, Lat lateral movement, Sup superior movement, Inf inferior movement, Sit in the sitting posture, Stnd in the standing posture

