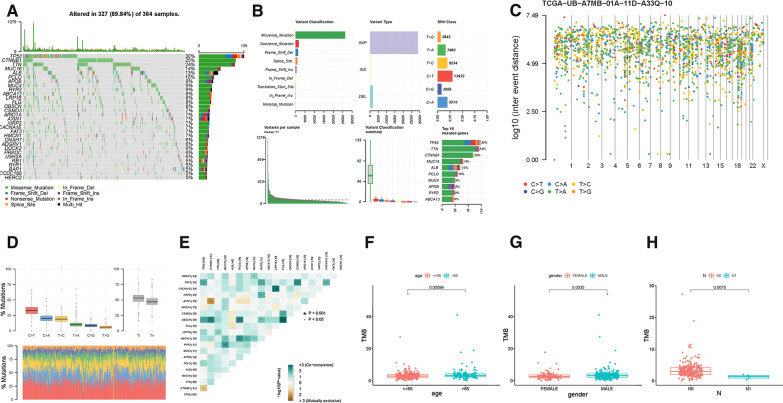
Fig. 1.
Landscape of somatic mutation profiles in HCC samples. A Mutation information of each gene in each sample was shown in the waterfall plot, where different colors with specific annotations at the bottom meant the various mutation types. The barplot above the legend exhibited the number of mutation burden. B Cohort summary plot displaying distribution of variants according to variant classification, type and SNV class. Bottom part (from left to right) indicates mutation load for each sample, variant classification type. A stacked barplot shows top ten mutated genes. C Rainfall plot of TCGA HCC sample TCGA − UB − A7MB − 01A − 11D − A33Q − 10. Each point is a mutation color coded according to SNV class. D Transition and transversion plot displaying distribution of SNVs in HCC classified into six transition and transversion events. Stacked bar plot (bottom) shows distribution of mutation spectra for every sample in the MAF file. E The coincident and exclusive associations across mutated genes. The correlation of TMB with age (F), gender (G) and T status (H)

