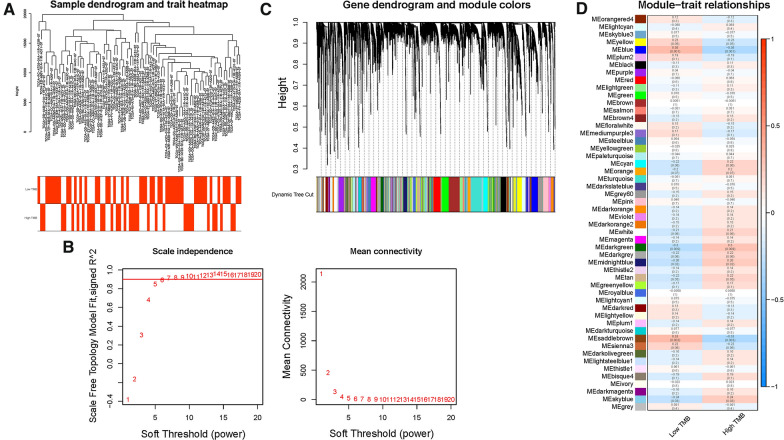
Fig. 2.
Construction of weighted gene co-expression network of HCC samples. A Sample dendrogram and clinical-traits heatmap was plotted. B Selection of the soft threshold made the index of scale-free topologies reach 0.90 and analysis of the average connectivity of 1–20 soft threshold power. C TMB-related genes with similar expression patterns were merged into the same module using a dynamic tree-cutting algorithm, creating a hierarchical clustering tree. D Heatmap of the correlations between the modules and TMB value (traits). Within every square, the number on the top refers to the coefficient between the TMB level and corresponding module, and the bottom is the P value

