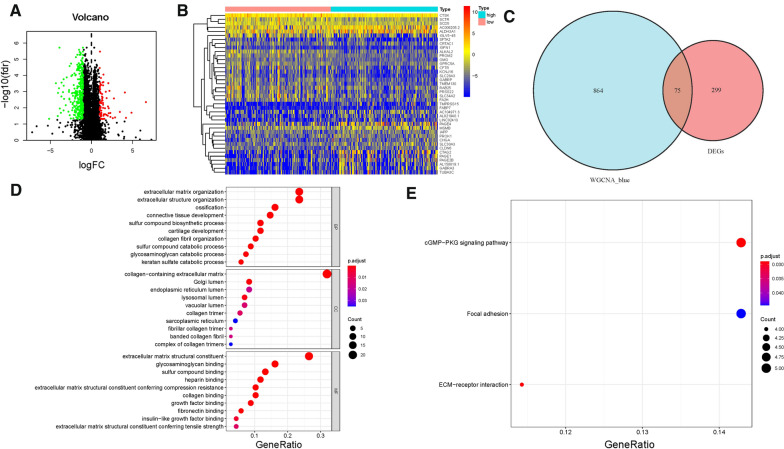
Fig. 3.
Differential analysis of gene expression data in high- and low-TMB groups and enrichment pathway annotation. A Volcano plot was delineated to visualize the DEGs. Red represented upregulated and green represented downregulated. B Heatmap of top 40 DEGs was drawn to reveal different distribution of expression state, where the colors of red to blue represented alterations from high expression to low expression. C Venn diagram of the hub genes from WGCNA blue module and DEGs. Pathway enrichment analyses of TMB hub genes. D Gene Ontology (GO) enrichment analysis of naïve B cells-related genes: biological processes (BP), cellular components (CC) and molecular function (MF). E KEGG enrichment analysis of naïve B cells-related genes

