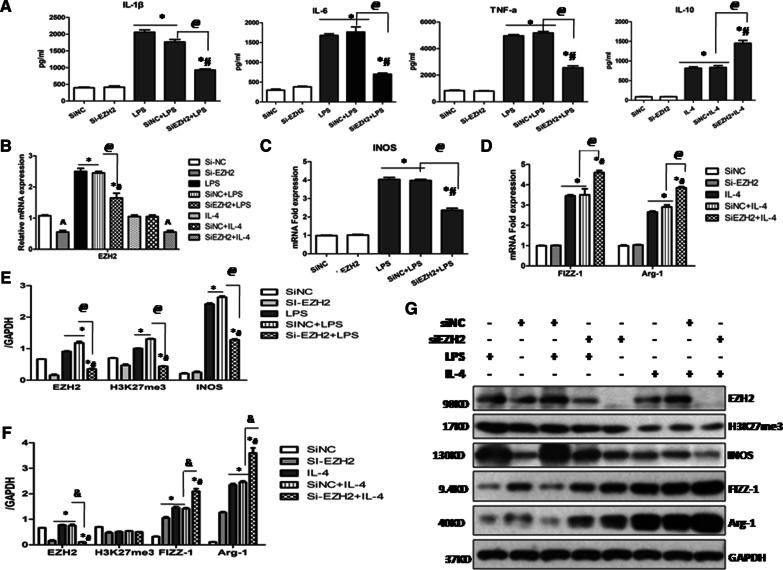
Fig. 4.
Knock down of EZH2 inhibited M1 macrophage polarization and promoted M2 phenotype in MH-S cells. MH-S cells were transfected with siRNA targeting EZH2 or scrambled siRNA and then exposed to either LPS (50 ng/ml) or IL-4 (10 ng/ml) for an additional 24 h. A The levels of IL-1β, IL-6, TNF-α were measured by ELISA in the supernatants of LPS stimulated MH-S cells and IL-10 levels were qualified by ELISA in IL-4 stimulated MH-S cells. B The mRNA expression of EZH2 was measured by quantitative PCR. C The mRNA expression of M1 marker (iNOS) was measured by quantitative PCR. D The mRNA expression of M2 marker (Arg-1 and FIZZ-1) was measured by quantitative PCR. E Expression levels of EZH2, H3K27me3 and iNOS were quantified by densitometry and normalized using GAPDH. F Expression levels of EZH2, H3K27me3, Arg-1 and FIZZ-1 were quantified by densitometry and normalized using GAPDH. G Representative Western blot depicting MH-S cell lysates probed for EZH2, H3K27me3, iNOS, Arg-1, FIZZ-1 and GAPDH. All data are expressed as mean ± SEM. (* p < 0.05 vs. SiNC and Si-EZH2 group, #p < 0.05 vs. LPS or IL-4 stimulated group, @p < 0.05 vs. SiNC + LPS group, & p < 0.05 vs. SiNC + IL-4 group and ^p < 0.05 vs. SiNC group determined by one-way ANOVA for multiple group comparisons)

