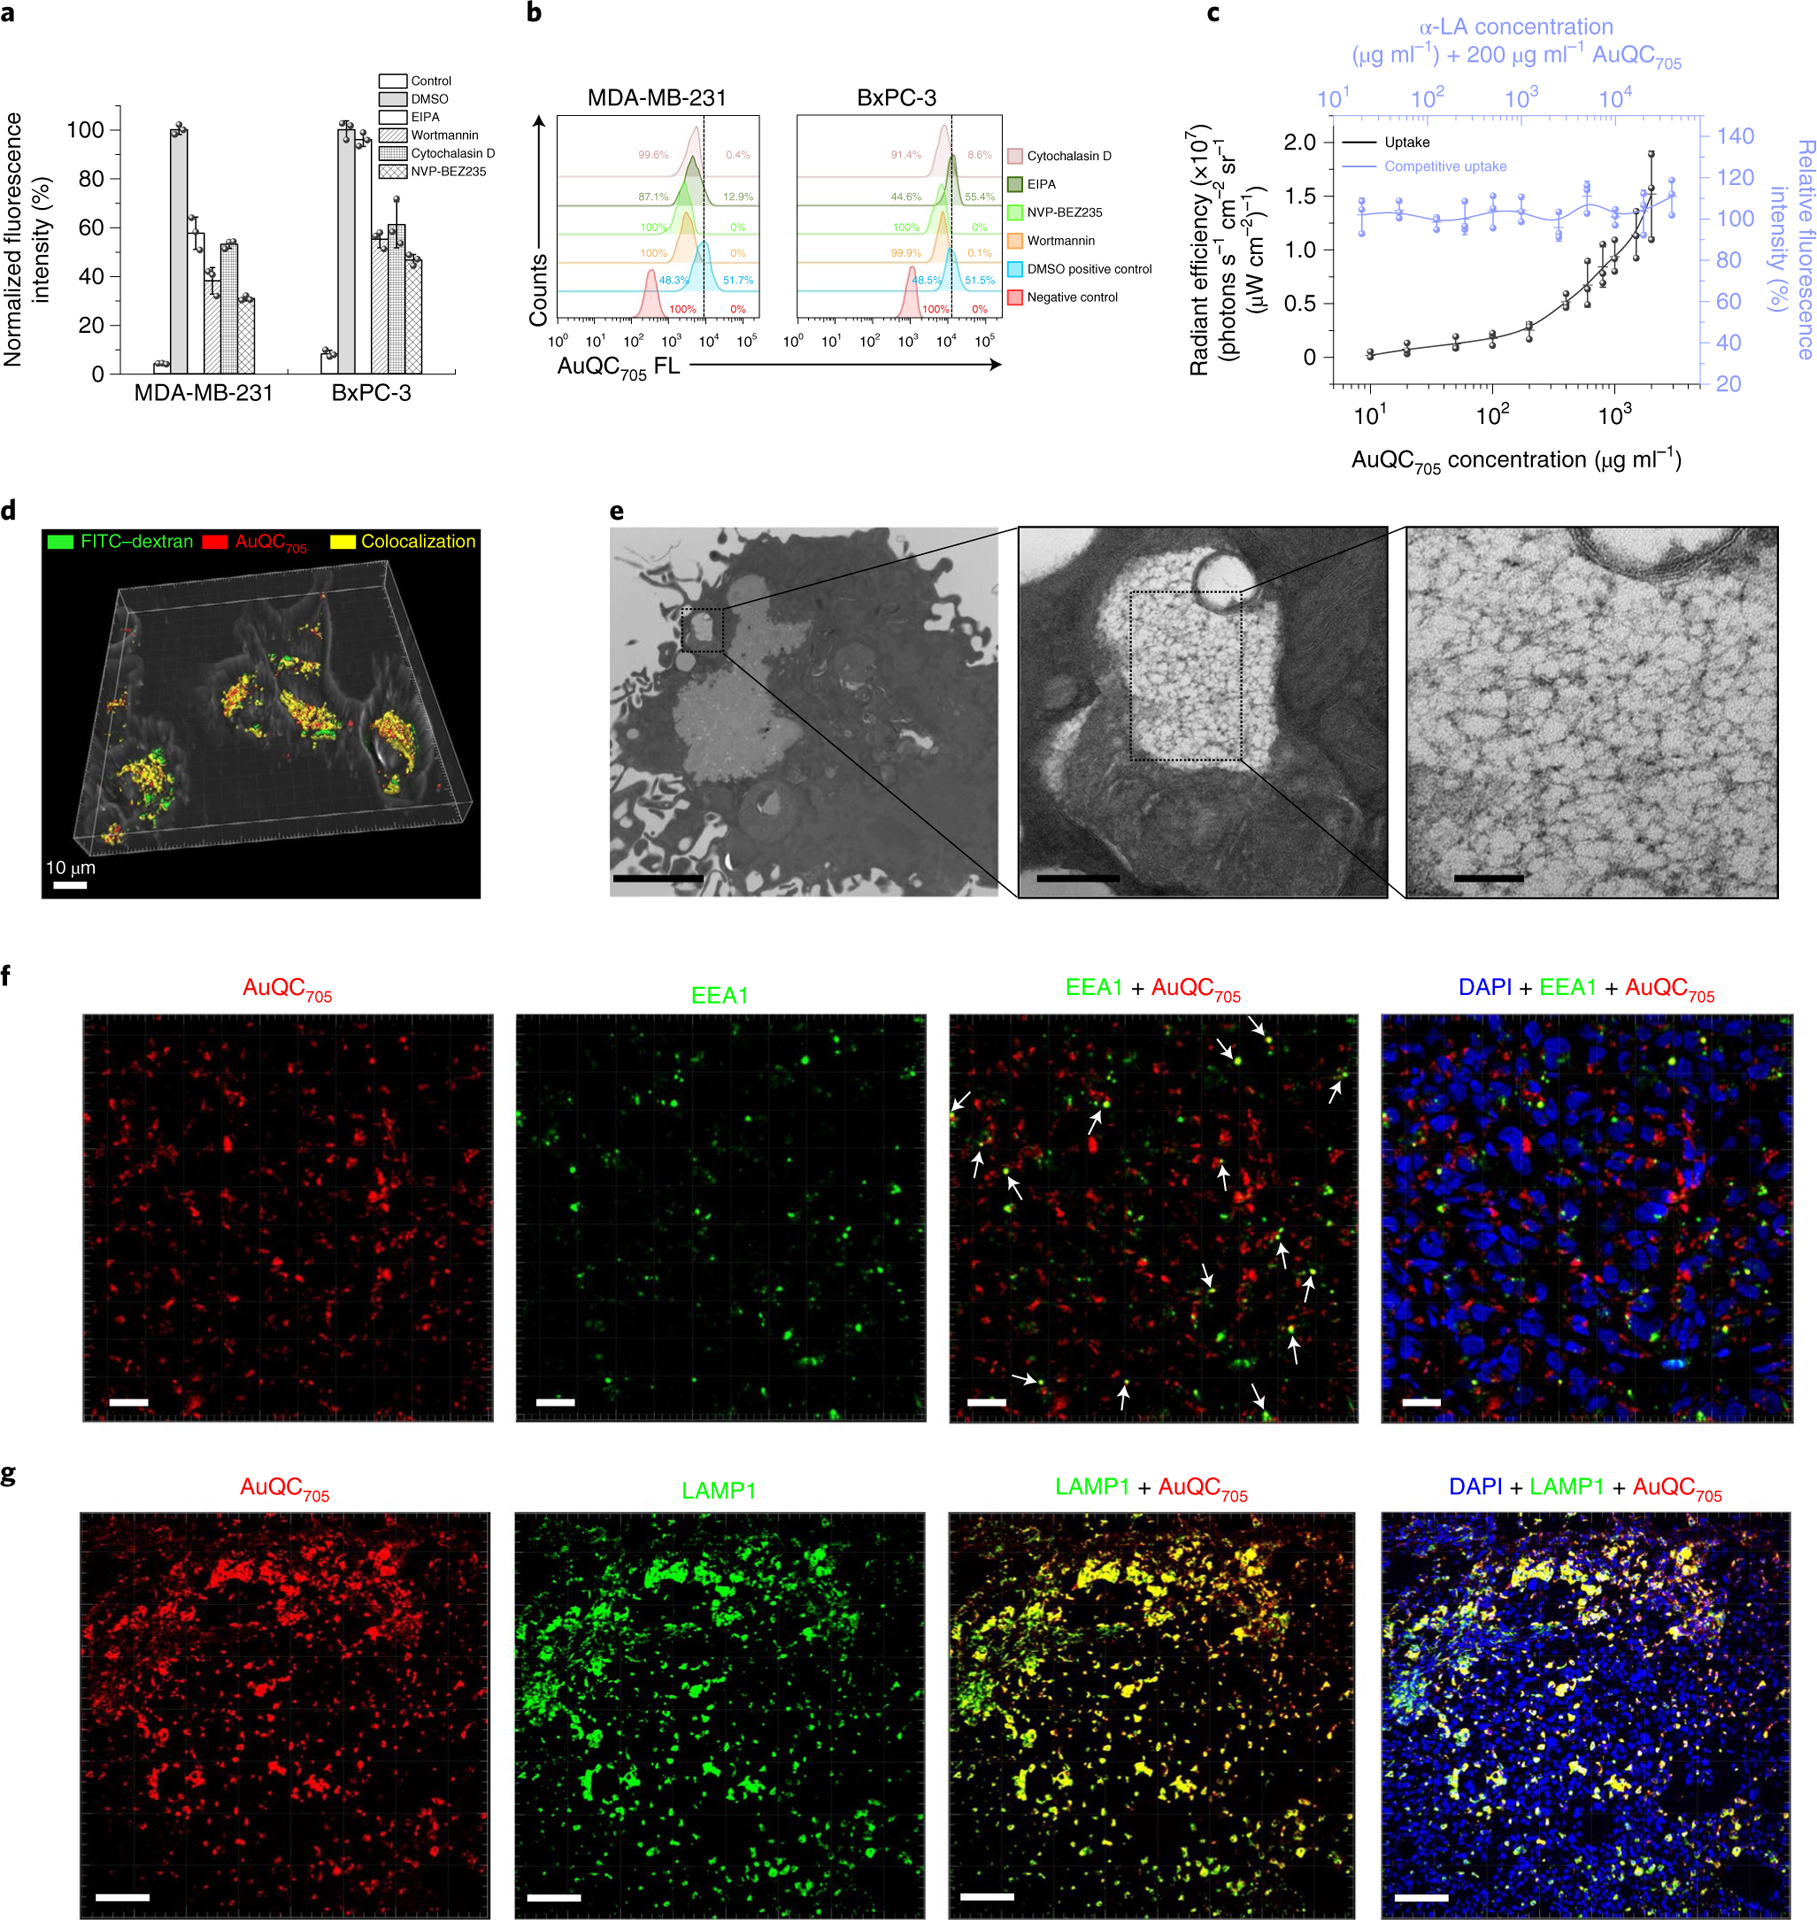
Fig. 3 |. The predominant endocytic trafficking pathway of AuQC705 in MdA-MB-231 human breast cancer cells and tumours is macropinocytosis.

a, The effects of pharmacological inhibitors; n = 3 biologically independent samples. b, Flow cytometry analysis corresponding to a with typical single-parameter gating for approximately 50% of the positive control without inhibitors shows inhibition of internalization. c, Direct and competitive uptake assays of AuQC705 in MDA-MB-231 cells demonstrated typical features of macropinocytosis; n = 3 biologically independent samples. While increasing concentrations of AuQC705 led to increased uptakes, no obvious blocking effects were observed in the presence of competitive α-LA. d, A three-dimensionally (3D) rendered image of a confocal z stack of MDA-MB-231 cells overlaid with a bright-field image. AuQC705 (red) and the macropinocytosis marker FITC–dextran (green) showed a high degree of cytosolic colocalization (yellow) at 2 h. Scale bar, 10 μm. A complete time course for organelle trafficking is shown in Supplementary Fig. 18. e, Ultrastructure analysis with TEM showing an early-formed multivesicular non-homogeneously large-sized (>0.2 μm) and irregularly shaped macropinosome vesicle in MDA-MB-231 cells after 1 h uptake. The cargo is close to the plasma membrane, indicating membrane closure and separation. AuQC705 maintained in ultrasmall size can be clearly observed as black dots in the vesicle without apparent aggregation, thereby preserving fluorescence. Scale bars, 2 μm (left), 200 nm (middle) and 50 nm (right). f, Immunofluorescence images of MDA-MB-231 tumours from a J:NU mouse 1 h after injection of AuQC705; DAPI was used to visualize nuclei (blue). The organelle trafficking of AuQC705 (red) and intracellular early endosome–macropinosome marker EEA1 (green) were in punctate patterns. Colocalizations are indicated by white arrows. Scale bars, 20 μm. g, The majority of AuQC705 (red) was found to end up in late endosomes and lysosomes in tumours 2 h after injection, as observed from the extensive colocalization (yellow) with LAMP1 (green). Scale bars, 100 μm.
