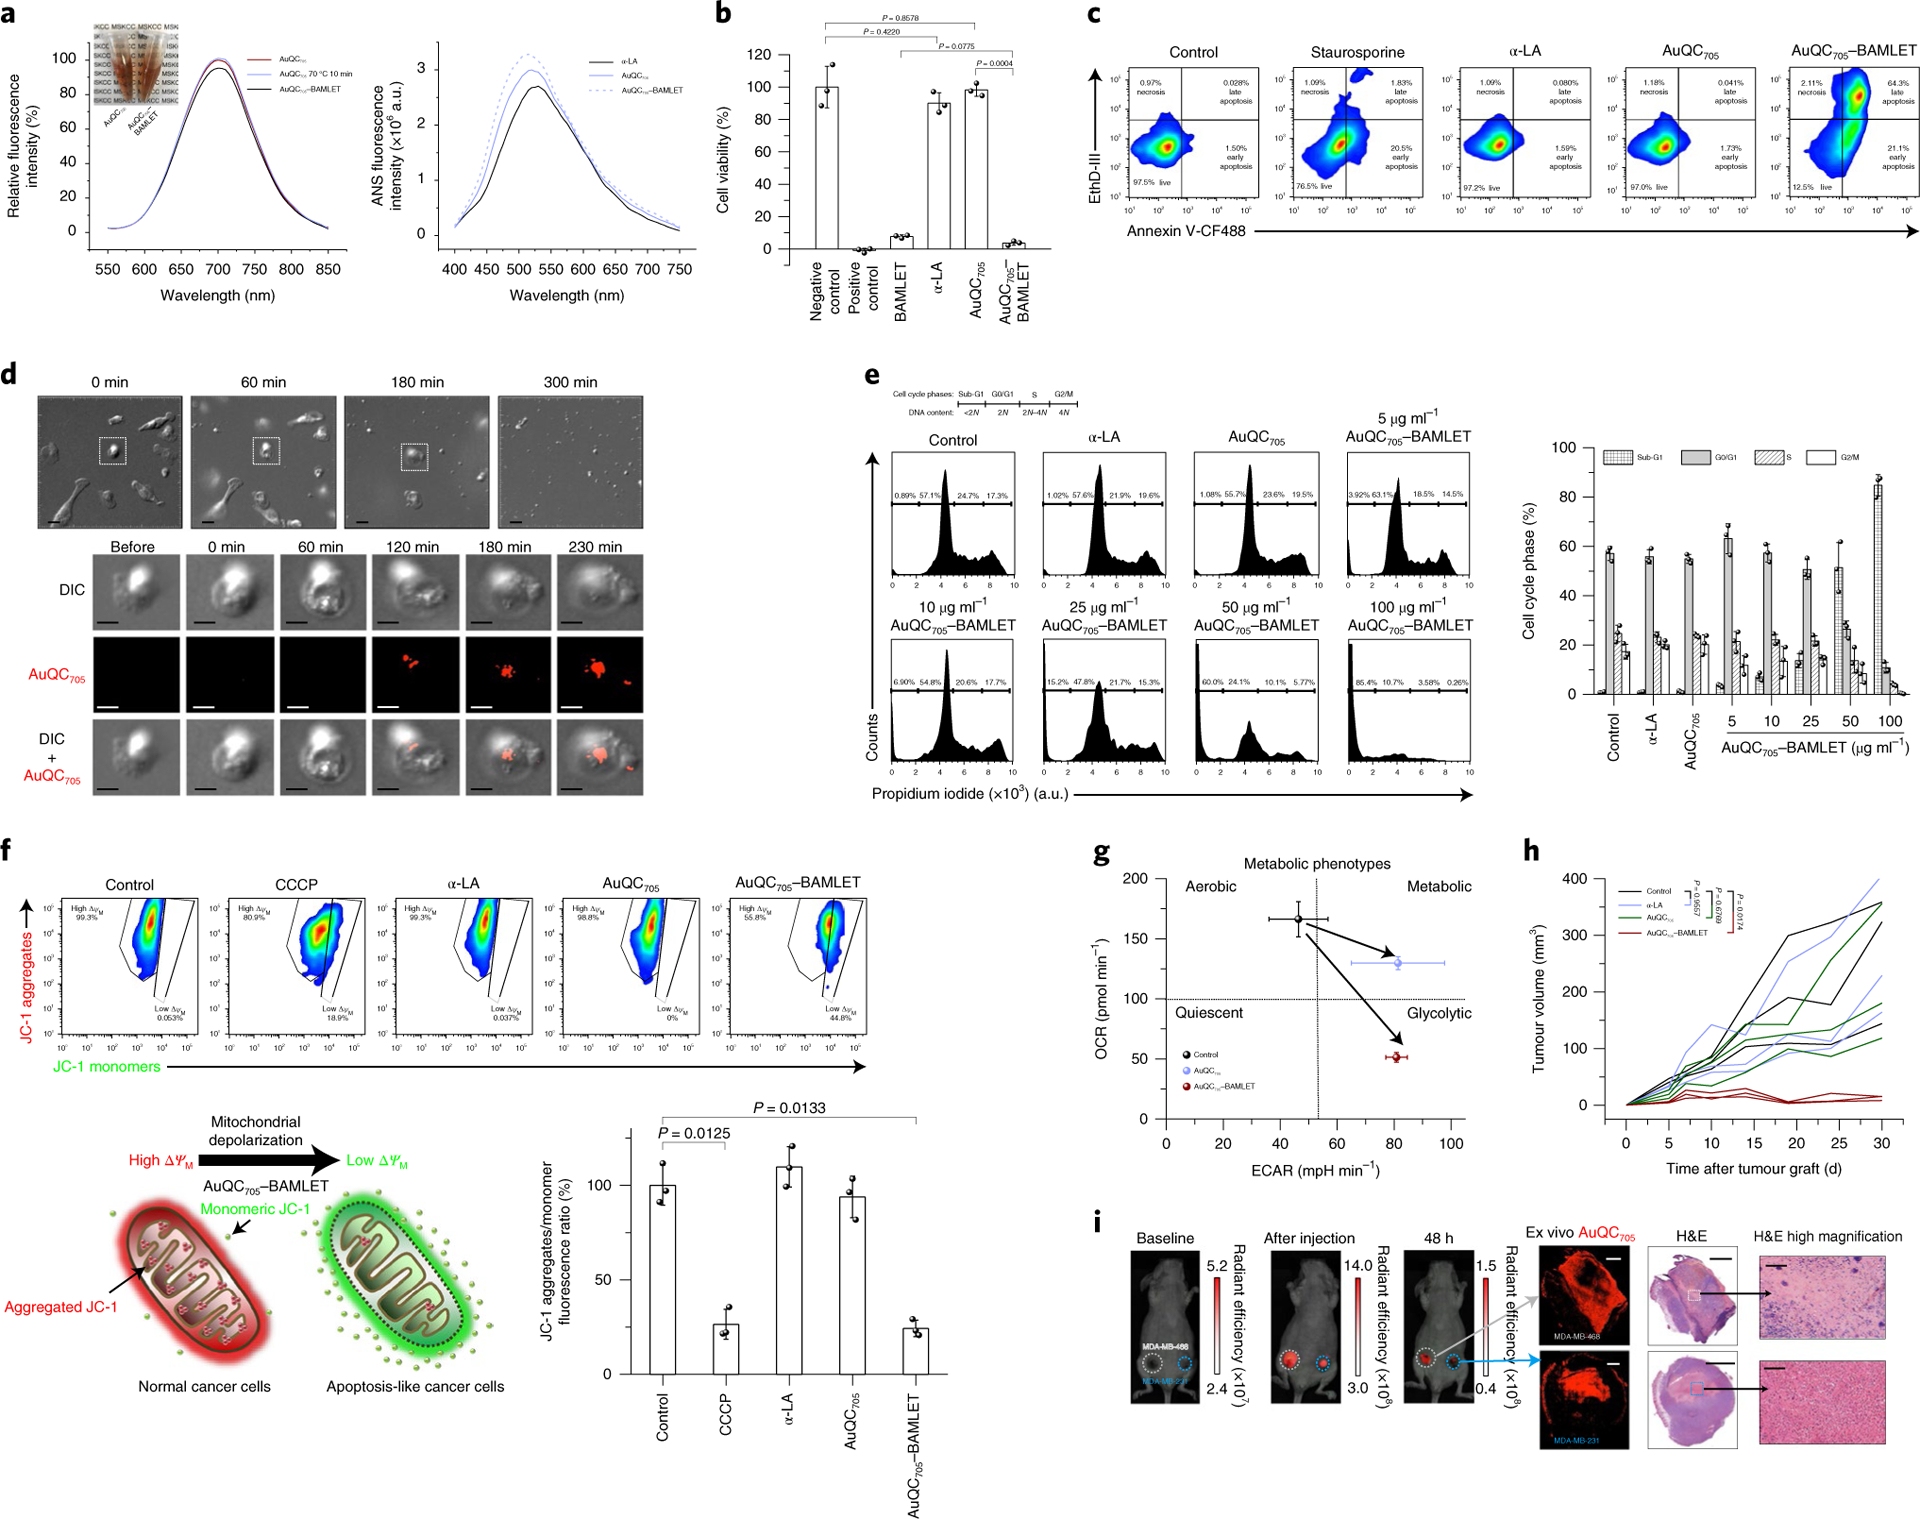
Fig. 6 |. AuQC705–BAMLeT is a potent nanocomplex for inducing cancer cell death.

a, Fluorescence spectra of AuQC705, AuQC705 after 10 min heat shock at 70 °C and AuQC705–BAMLET at pH 7 (left). Inset: decrease in optical transparency after formation of AuQC705–BAMLET. Right, ANS spectra of α-LA, AuQC705 and AuQC705–BAMLET, reflecting surface hydrophobicity. a.u., arbitrary units. b, The viability of MDA-MB-231 cancer cells after 3 h treatment of BAMLET (2 mg ml−1), α-LA (2 mg ml−1), AuQC705 (100 μg ml−1) and AuQC705–BAMLET (100 μg ml−1); n = 3 biologically independent samples. For the positive control, 1 mM SDS was used. c, Flow cytometry analysis of MDA-MB-231 cells that were stained with annexin V-CF488 (excitation, 488 nm; emission, 530/50 nm band pass (BP)) and EthD-III (excitation, 532 nm; emission, 610/20 nm BP) for early apoptosis and late apoptosis/necrosis, respectively, after 3 h treatment of α-LA, AuQC705 and AuQC705–BAMLET (75 μg ml−1). Staurosporine (5 μM) was used as an apoptosis-inducing control. The percentage of cells in each quadrant is indicated. d, Time-lapse DIC microscopy of MDA-MB-231 cells treated with 250 μg ml−1 AuQC705–BAMLET (top). Bottom, morphological and intracellular fluorescence analysis of a single cell. Scale bars, 20 μm (top row) and 10 μm (bottom three rows). e, Cell cycle analysis by quantifying DNA content using the intracellular DNA-binding dye propidium iodide (excitation, 532 nm; emission, 610/20 nm BP); n = 3 biologically independent samples. MDA-MB-231 cancer cells were treated with 2 mg ml−1 α-LA, 100 μg ml−1 AuQC705 and 5–100 μg ml−1 AuQC705–BAMLET for 1 h. The percentage of cells is indicated on the plot for cell cycle phases of sub-G1, G0/G1, S and G2/M corresponding to DNA content of <2 N, 2 N, 2N–4N and 4 N, respectively (left). Right, the percentage of each cell cycle phase. f, Flow cytometry analysis of mitochondrial membrane potentials (ΔΨM) using lipophilic cationic JC-1 with 100 μM carbonyl cyanide 3-chlorophenylhydrazone (CCCP) as a positive control; n = 3 biologically independent samples. The top left gate represents normal mitochondria in healthy cells with high ΔΨM, intense in red fluorescence (excitation, 532 nm; emission, 610/20 nm BP) from JC-1 aggregates. The cell population in the bottom right gate has low ΔΨM with green fluorescence (excitation, 488 nm; emission, 530/50 nm BP) from monomeric JC-1. The schematic shows the shift of red fluorescence of JC-1 aggregates into green fluorescence of JC-1 monomers by AuQC705–BAMLET, causing mitochondrial depolarization (bottom left). The ratio of JC-1 aggregates to monomers (red/green fluorescence ratio) is a sensitive indicator of mitochondrial membrane polarization (bottom right). g, Cell energy phenotype diagram showing phenotypic switching of MDA-MB-231 cells from the baseline control by AuQC705 and AuQC705–BAMLET; n = 2 biologically independent samples. OCR, oxygen consumption rate; ECAR, extracellular acidification rate. h, Tumour growth patterns of MDA-MB-231 human xenografts co-implanted with AuQC705–BAMLET. AuQC705–BAMLET showed statistically significant growth inhibition compared with the control group, whereas no significance was found for either α-LA or AuQC705; n = 3 biologically independent animals. i, Localized anti-cancer therapy guided by NIR-fluorescence images in dual orthotopic MDA-MB-231/468 breast cancer models using AuQC705–BAMLET. The unit of radiant efficiency is photons s−1 cm−2 sr−1 (μW cm−2)−1. No AuQC705–specific signals were detected at the baseline. AuQC705–BAMLET induced potent cell death and was confined within the tumours, as visualized by fluorescence. Spatially defined drug distribution within the tumours was revealed by ex vivo microscopic imaging after identical in vivo imaging patterns were observed in both of the tumours, and was in agreement with the histopathology analysis. Newly differentiated viable cancer cells have low AuQC705 signals, whereas strong signals from AuQC705–BAMLET correlate well with cell death. One enlarged region of cell death is presented for each tumour. H&E, haematoxylin and eosin. Scale bars, 1,000 μm (left), 2,000 μm (middle) and 100 μm (right).
