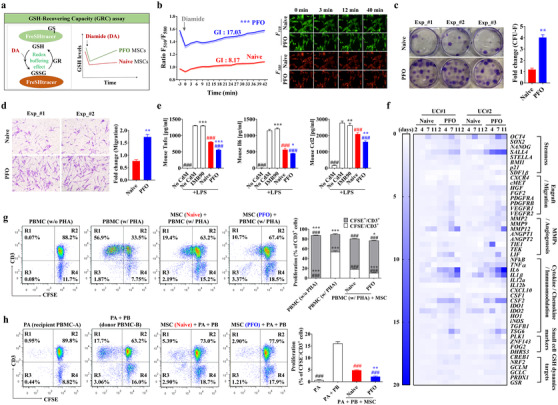
FIGURE 2.

Enhanced immunomodulatory activities of small‐sized UC‐MSCs with high GSH dynamics. (A and B) Schematic overview (A) and FR plot (B) of the GSH‐recovering capacity (GRC) and basal GSH levels in naïve and PFO UC‐MSCs, generated by AA2G treatment for 7 days, as shown by FreSHtracer, in response to exposure to 100 μM diamide (arrow). The GSH dynamics index (GI) of each sample was quantified based on both initial F510/F580 fluorescence ratio (FR) (for baseline total GSH) and slope after diamide treatment (for GRC), as previously described. 7 (B) FR plots with GI values (left panel) for each group (n = 6) and representative images (right panel) of F510 (GSH bound) and F580 (GSH free) fluorescence. (C and D) Colony forming unit‐fibroblast activity (C, CFU‐F) and chemotactic transwell migration activity in response to platelet‐derived growth‐factor (D, PDGF) of naïve and PFO UC‐MSCs generated by AA2G treatment for 7 days. Representative results of each assay are shown in the left panel (D, × 200 magnification; scale bar=100 μm). Data are presented as mean ± SEM (n = 6) ratios relative to naïve cells and analyzed by non‐parametric Mann–Whitney U tests. **p < 0.01 compared with the naïve MSC group. (E) In vitro anti‐inflammation assays using conditioned media (CdM) prepared from the indicated UC‐MSCs. Secretion of mouse pro‐inflammatory cytokines, including tumor necrosis factor‐α (Tnfα), interleukin‐6 (Il6), and C‐C motif chemokine ligand‐2 (Ccl2), by MH‐S cells, a murine alveolar macrophage cell line stimulated with LPS for 8 h in the absence or presence of CdM harvested from the indicated cells. IMR90, a normal primary fibroblast line, was used for control. These data are reported as the mean ± SEM (n = 4) ratios relative to naïve MSCs and analyzed by one‐way ANOVA with Bonferroni post hoc tests. *p < 0.05, **p < 0.01, ***p < 0.001 compared with naïve cells. ###p < 0.001 compared with LPS‐stimulated MH‐S in the absence of CdM (No CdM). (F) Heatmap analysis of RQ‐PCR assays showing the expression of the indicated genes in naïve and PFO human UC‐MSCs from two independent donors (UC#1 and UC#2) generated by AA2G treatment for the indicated number of days. Levels of expression are shown as fold changes relative to naïve MSCs. Source data are available in Dataset S1. (G and H) Representative flow cytometry cytograms and quantitative (n = 4) results of the suppression of T‐cell proliferation (CFSE−/CD3+) in PHA‐stimulated (G) and allogeneic stimulated (H) PBMCs by co‐culture with naïve and PFO UC‐MSCs (AA2G for 7 days). (H) In the mixed lymphocyte reaction assays, single (PA) and allogeneic PBMCs (PA + PB) were co‐cultured with the indicated human UC‐MSCs. Statistical analyses were performed using one‐way (H) or two‐way (G) ANOVA with Bonferroni post hoc tests. **p < 0.01, ***p < 0.001 compared with naïve MSCs. ###p < 0.001 compared with controls for each assay (G, PBMC treated with PHA alone; H, PA + PB)
