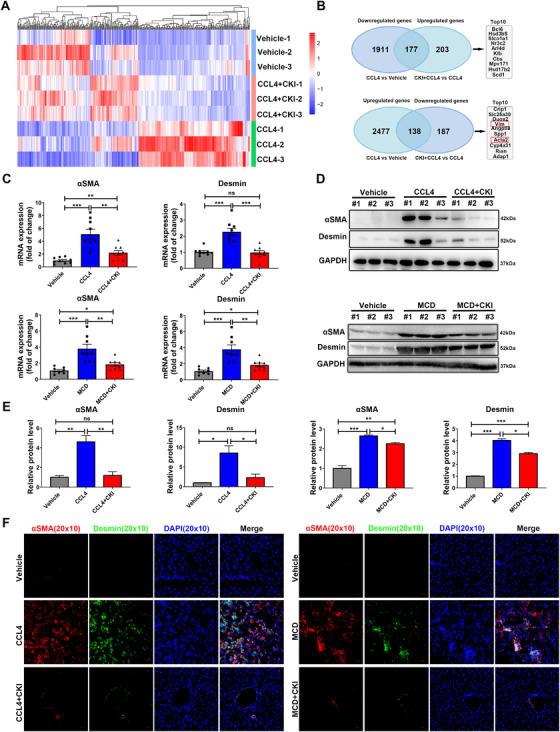
FIGURE 3.

CKI inhibits liver fibrosis by suppressing HSCs activation in vivo. (A) Mice were intraperitoneally treated with 4 ml/kg CCl4 for 6 weeks along with CKI treatment (7.5 ml/kg) for 3 weeks. Later, liver tissues were collected for RNA‐sequence (n = 3 for each group). Heat map for differentially expressed genes between vehicle, CCl4, and CCl4 + CKI group. (B) Venn analysis of upregulated genes and downregulated genes from CCl4 + CKI versus CCl4 treatment and CCl4 versus vehicle treatment. The top 10 upregulated genes and downregulated genes are shown from CCl4 + CKI versus CCl4 treatment. (C) mRNA expression of αSMA and desmin were analyzed by qRT‐PCR in the liver tissues from CCl4‐challenged (above) or MCD diet‐challenged (below) mice. (D) Western blot assay for detecting the expression of αSMA and desmin in mice liver tissues. (E) Quantitative analysis of the protein expression of αSMA and desmin. (F) Representative immunofluorescence staining images of αSMA and desmin of liver sections from CCl4‐treated (left) or MCD diet‐treated (right) mice (original magnification 20 × 10, scale bar 50 μm). Data are presented as means ± SEM. ns, p > 0.05; *p < 0.05; **p < 0.01; ***p < 0.001
