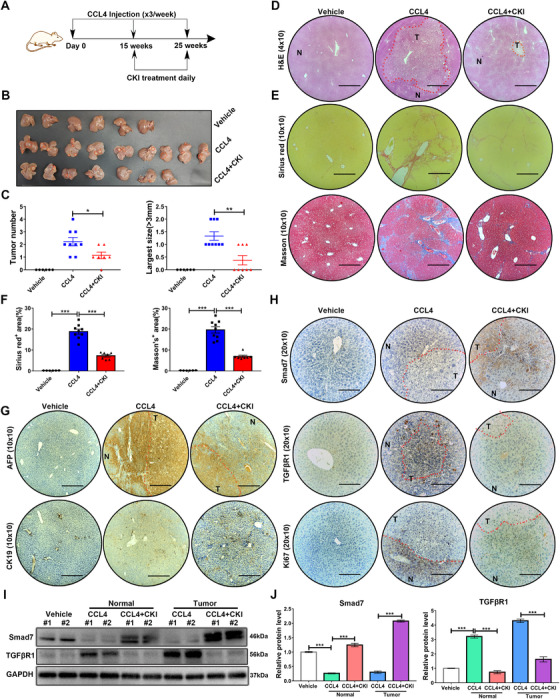
FIGURE 8.

CKI intervention postpones HCC in CCl4‐challenged mice. (A) Scheme of experimental procedure for C57BL/6 mice intraperitoneally treated with 4 ml/kg CCl4 in olive oil for 25 weeks. Mice were intraperitoneally administrated with CKI at 7.5 ml/kg for 10 weeks, starting at 15 weeks post initiation of CCl4 challenge. (B) Photographs of mouse livers from vehicle (n = 6), CCl4 (n = 9), and CKI intervention (n = 7) groups. (C) Tumor number and the largest size (>3 mm) were quantified in different groups. (D) Representative images of H&E staining of mouse liver tissues are shown (original magnification 4 × 10, scale bar 890 μm). (E) Representative images of Sirius Red and Masson's trichrome staining are displayed in different treatment groups (original magnification 10 × 10, scale bar 350 μm). (F) Positive Sirius Red or Masson staining area were quantified by ImageJ analysis in each group. (G) Representative immunostaining of AFP and CK19 in mouse liver tissues are shown from indicated treatment (original magnification 10 × 10, scale bar 360 μm). (H) Representative immunostaining of Smad7, TGFβR1, and Ki67 of mice livers are shown (original magnification 20 × 10, scale bar 180 μm). (I) Western blot analysis of Smad7 and TGFβR1 in mice liver tumors and surrounding normal liver tissue. (J) Quantitative analysis of the protein expression of Smad7 and TGFβR1. N, normal liver tissue; T, tumor. Data are presented as means ± SEM. ns, p > 0.05; *p < 0.05; **p < 0.01; ***p < 0.001
