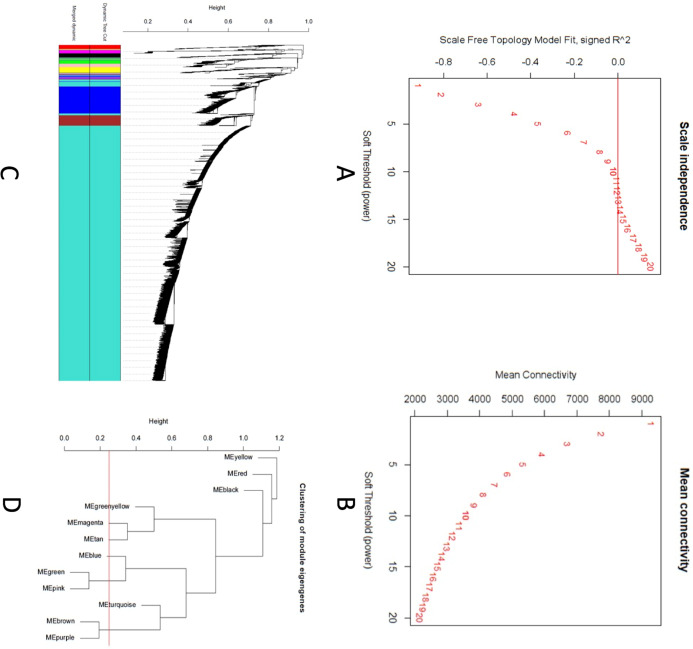
Figure 2. Co-expression network analysis using WGCNA.
(A) Scale-free fit index versus soft-thresholding power. (B) Mean connectivity versus soft-thresholding power of 12. (C) Cluster dendrogram based on dissimilarity measures (1-TOM). The branches correspond to modules of highly interconnected groups of genes. Colors in the horizontal bar represent the modules. A total of 12 modules were identified. (D) Module network dendrogram constructed by clustering module eigengene distances. The red line shows the merging threshold.

