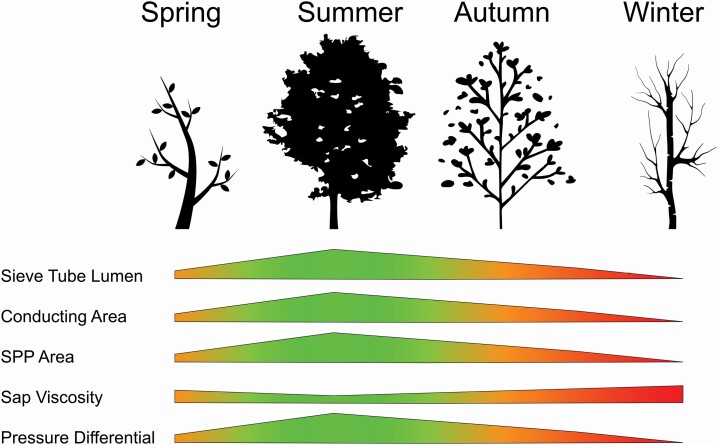
Figure 1.
The effects of changes in anatomical and physiological parameters on phloem sap flow during the year. Polygon width indicates the relative change to the parameter listed in the left column and colours indicate relative effect on sap flow where orange is a moderate flow, green is optimal flow and red is little to no flow. SPP = Sieve plate pore.

