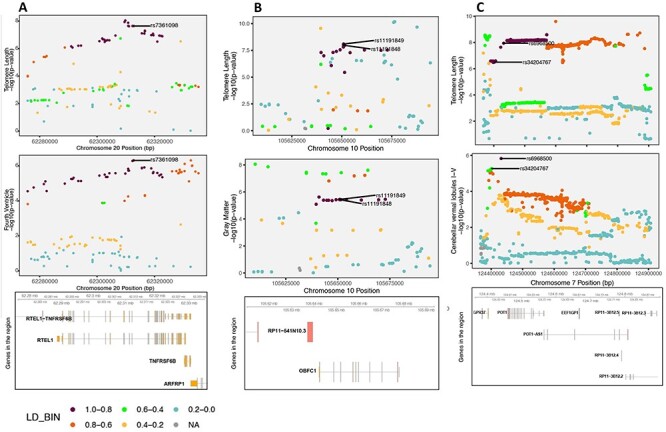
Figure 2.

Genetic colocalization. (A) Regional association plot for LTL and fourth ventricle on chr20(q13.33) and the top significant variants for both traits in the locus is shown followed by genes in the region (hg19 build). (B) Regional association plot for LTL and gray matter on chr10(q24.33) and the top significant variants for both traits in the locus is shown followed by genes in the region (hg19 build). (C) Regional association plot for both traits on chr7(q31.33) and the top two most significant variants in the locus are shown followed by genes in the region (hg19 build).
