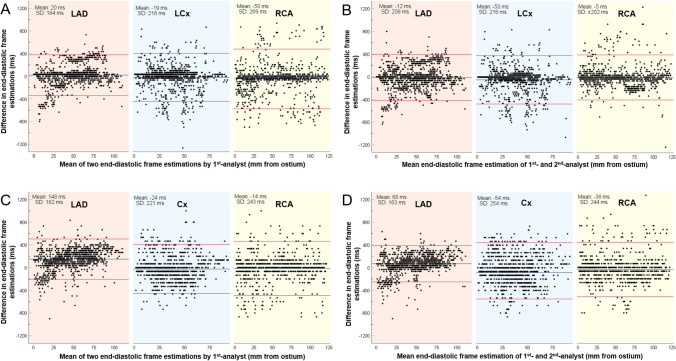
Fig. 3.
Bland–Altman analyses between the first and second set of estimations of the 1st-analyst at the NIRS-IVUS sequences acquired at 30fps (a) and 15fps (b) and between the estimations of the 1st- and 2nd-analyst in the same data set (c at 30fps; d at 15fps). Results are shown for the left anterior descending (LAD), left circumflex (LCx), and right coronary artery (RCA). The blue line represents the mean difference and the red lines correspond to the limits of agreement i.e., ± 1.96 standard deviation (SD)

