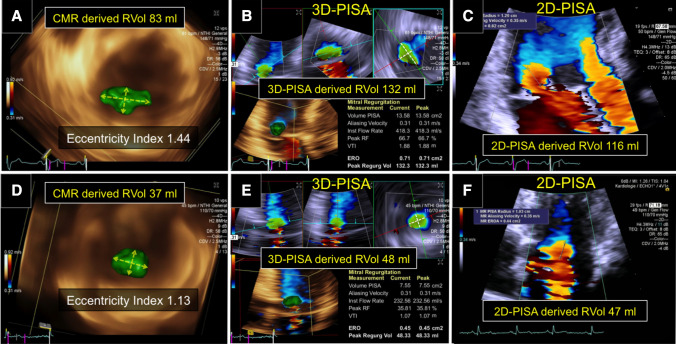
Fig. 4.
Difference in RVol by 2D-PISA and 3D-PISA methods according to eccentricity index. Clinical cases: (a, b, and c) example with an asymmetric 3D-FCR showing a difference in RVol between 3D-PISA and 2D-PISA of 16 ml. d, e, and f example of a late-systolic mitral regurgitation with a symmetric 3D-FCR showing no significant difference in RVol between methods. a and d, isovelocity surface mesh en-face from left ventricle depicting the ratio (eccentricity index) between two orthogonal radii (yellow arrow). b and e, 3D-PISA measurements from multi-planar reconstruction. c and f, 2D-PISA measurements from apical views. Abbreviations as in Fig. 1

