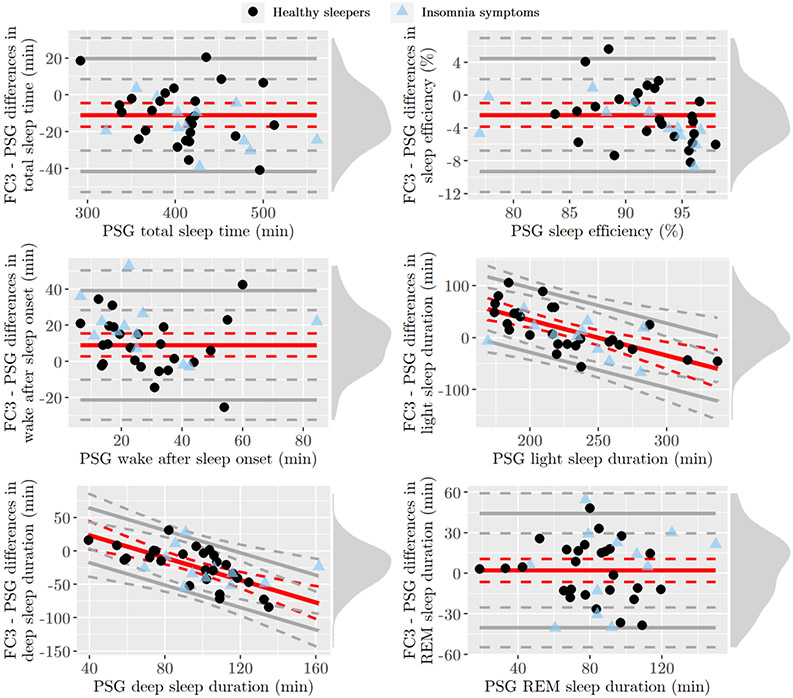
Figure 1.
Bland-Altman plots of sleep measures in the sample of healthy sleepers (black dots) and adolescents with insomnia symptoms (blue triangles). PSG, polysomnography; REM, Rapid-Eye-Movement. Red solid lines indicate bias, whereas gray solid lines indicate the 95% limits of agreement (LOAs), both with their 95% confidence intervals (dotted lines), computed from the group of healthy sleepers. Density diagram on the right side of each plot represents the distribution of FC3-PSG differences among healthy sleepers.

