
Fig. 1.
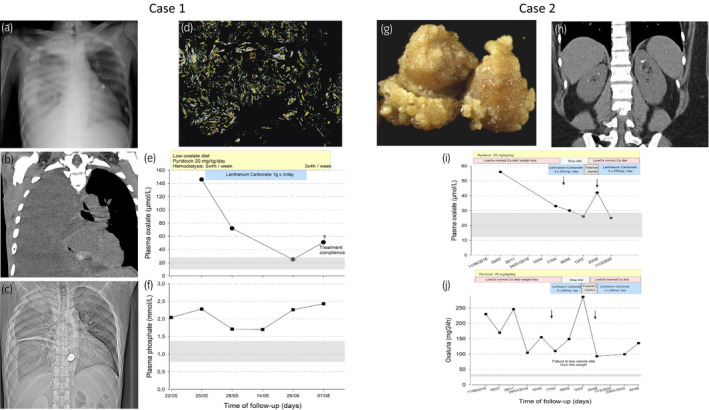
Representative images of chest radiography (a and c) and chest tomography (b) right pleural effusion and marked oxalate osteopathy. (d) Diffuse oxalate calcium depositions within the pleural biopsy (bipolarized microscopy). Graphical representation of plasma oxalate and phosphoremia (e and f, respectively) time course during the follow up of patient 1. Photography of kidney stones with typical futures of type Ic: budding surface with light cream to pale yellow, sometimes whitish areas (g) and abdominal tomography with bilateral kidney stones (h). Graphical representation of plasma oxalate and urinary oxalate excretion (i and j, respectively) time course during the follow up of patient 2