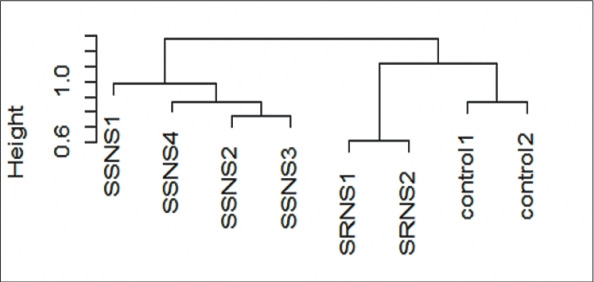
Fig. 1.

Unsupervised hierarchical cluster dendrogram. Unsupervised cluster analysis with a normalized and filtered (standard deviation ≤ 0.1) subset of podocyte gene expression profiles (16355) that revealed 2 major clusters and 6 subclusters. Group 1: all SSNS; group 2: SRNS versus control. SRNS, steroid-resistant nephrotic syndrome; SSNS, steroid-susceptible nephrotic syndrome.
