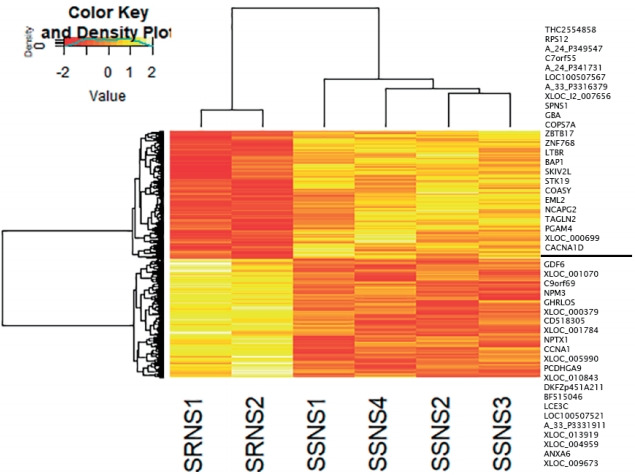
Fig. 3.

DGE analysis of SSNS versus SRNS. The heat map was constructed with corresponding normalized values of genes (P≤0.05) in each subgroup to visualize the differences in expression patterns. On applying the cutoff of -1< log FC >1, a total of 46 genes (24 upregulated, 22 down-regulated) were identified (indicated to the right of the heatmap). DGE, differential gene expression; SRNS, steroid-resistant nephrotic syndrome; SSNS, steroid-susceptible nephrotic syndrome.
