Fig. 4.

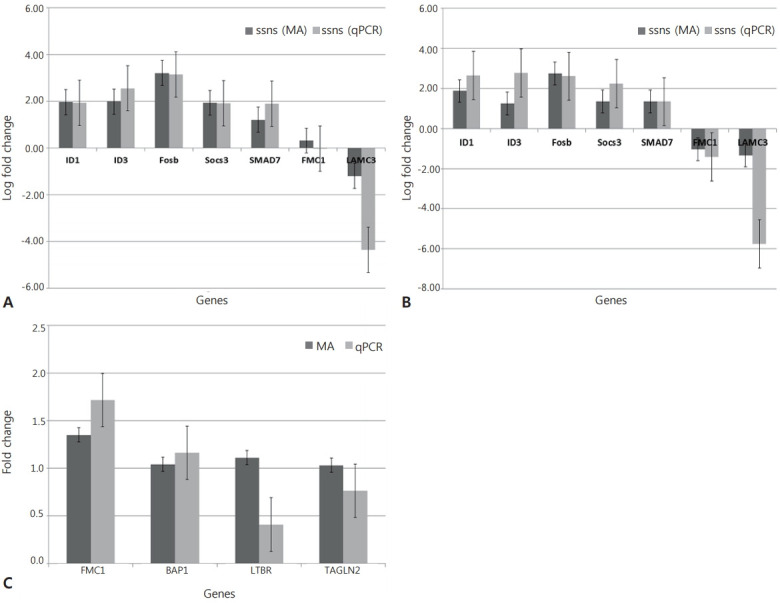
Verification of candidate genes identified in the microarray by qRT-PCR. Comparison of expressions of candidate genes identified in the differential gene expression analysis. (A) SSNS versus control, (B) SRNS versus control, and (C) SSNS against SRNS. The dark-colored bars represent the log fold change in microarray and light-colored bars represent log fold change in qRT-PCR. qRT-PCR, quantitative reverse transcription-polymerase chain reaction; SRNS, steroidresistant nephrotic syndrome; SSNS, steroid-susceptible nephrotic syndrome. MA, microarray.
