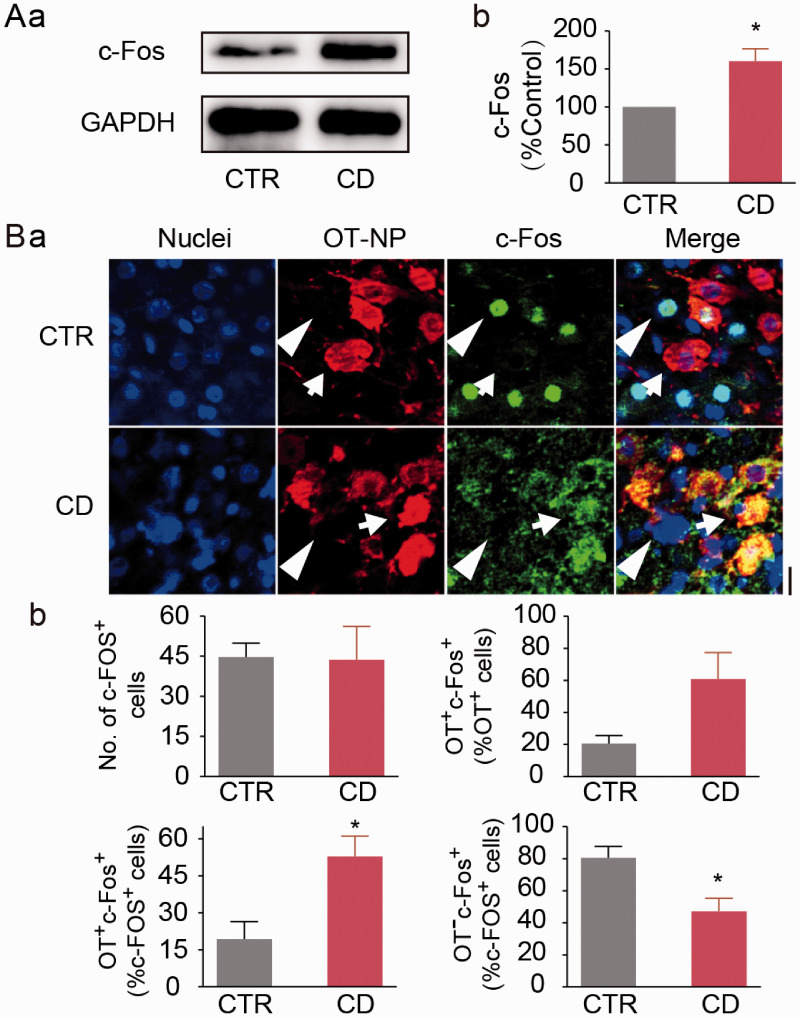
Figure 4.
Effects of CD on c-Fos Expression in the SON. A: Representative Western blotting bands (a) and the summary graph (b) showing c-Fos protein expression at day 5. B: Representative fluorescent images of immunohistochemistry showing nuclei (in blue), OT neurophysin (OT-NP, in red), c-Fos (in green), and their merges (a) and the summaries (b). Arrows and arrowheads point to OT and putative VP neurons, respectively. The scale bar equals to 20 µm. Other annotations are the same as Figures 1 and 2.

