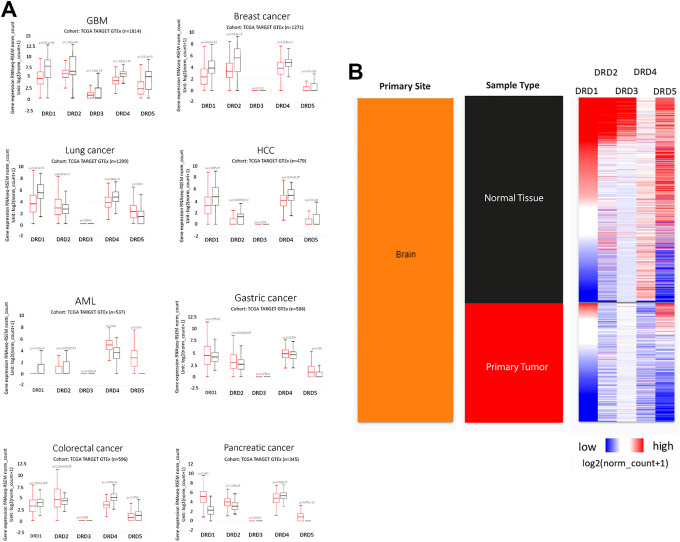
Figure 1.
Dopamine receptors (DRs) gene expression in tumors. A, mRNA expression of DRs in different tumors (red boxes) and their corresponding normal tissues (black boxes). Statistical analysis was performed using Welch’s t-test. B, Comparison of the expression of DRs in brain tumors vs. normal tissue. Plots were generated using the UCSC Xena platform with data from the TCGA TARGET GTEx database.

