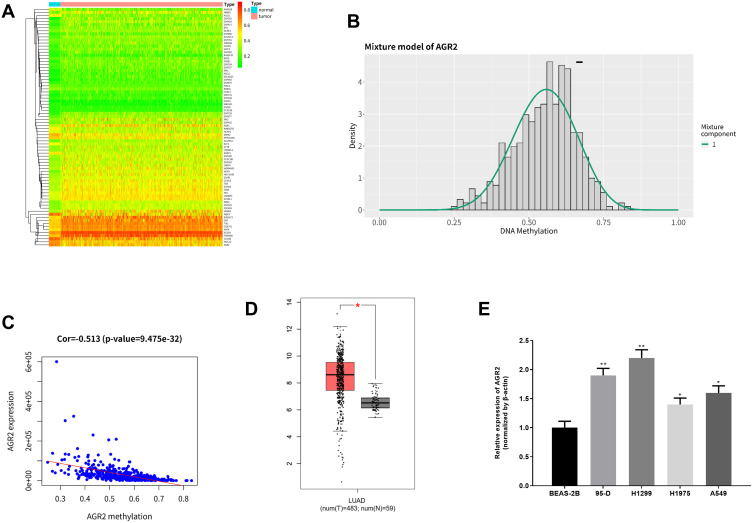
Figure 1.
Methylation-driven gene analysis and expression of AGR2 in LUAD. (A) The heat map of 78 methylation-driven genes in TCGA-LUAD dataset (red represents high expression and green represents low expression); (B) Methylation level distribution of driven-gene AGR2 (the short line represents the methylation level in normal tissues); (C) Correlation between methylation level and expression level of the methylation-driven gene AGR2; (D) Relative expression of AGR2 in TCGA-LUAD was downloaded from TCGA database. Red represents tumor tissue sample (n=483) and black represents normal tissue sample (n=59); (E) The expression of AGR2 in LUAD cell lines and normal cell line was detected by qRT-PCR. **P<0.01, *P<0.05.

