Fig. 1.

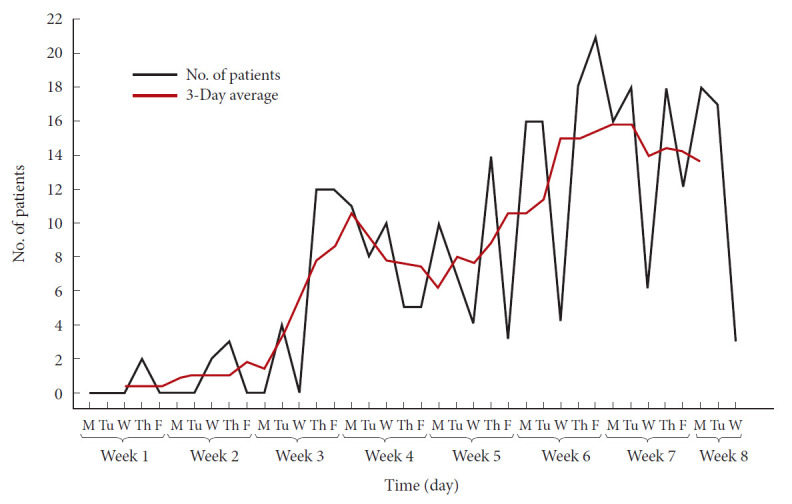
Line graph of video visits at our spine surgery clinic in the weeks following the city-mandated shelter-in-place order. Daily video visits (thin black line) and the 3-day video visit moving average are shown (thick red line).

Line graph of video visits at our spine surgery clinic in the weeks following the city-mandated shelter-in-place order. Daily video visits (thin black line) and the 3-day video visit moving average are shown (thick red line).