Fig. 2.
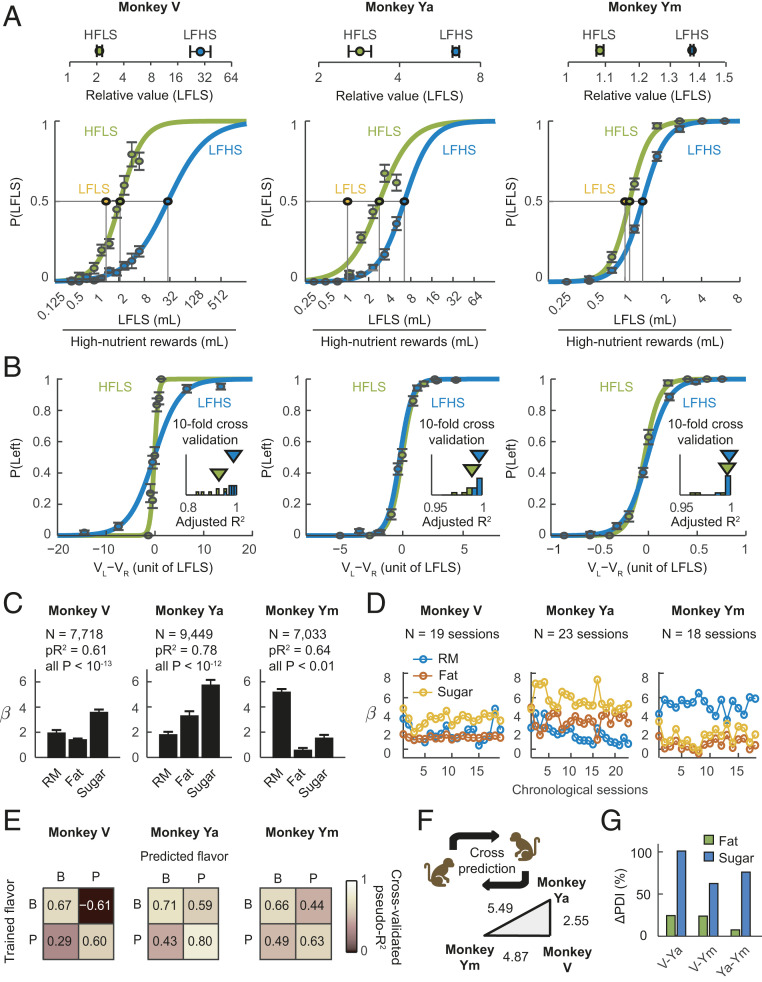
Nutrient–value functions explain monkeys’ fat and sugar preferences, predict choices across flavors, and account for individual differences. (A) Nutrient–value functions in three animals across sessions. Choice frequencies for the low-nutrient reference as a function of offered magnitude ratios (error bars: SEM). (Top) Indifference points identify animal-specific subjective values for high-nutrient rewards (relative values and 95% CIs). (B) Out-of-sample validation of subjective values. Relationships between choice probabilities and subjective value differences. Subjective values were derived from animal-specific indifference points in A by transforming offered magnitudes of high-nutrient rewards into value equivalents of the low-nutrient option (10-fold cross validation). (Insets) Adjusted R2 values from sigmoid fits. (C) Nutrient values across all choice conditions. Mixed-effects logistic regression of monkeys’ choices on reward magnitudes (RM) and fat and sugar contents (“nutrient model”), calculated over all sessions. All three animals showed significant coefficients (± SEM) for fat and sugar on choices. (D) Stable fat and sugar effects across testing sessions, suggested by chronological session-wise regression coefficients from mixed-effects nutrient model. (E) Cross-flavor choice prediction. Confusion matrices show cross-validated pseudo-R2 values obtained by fitting the nutrient regression on choices for one flavor (P: peach, B: blackcurrant) to predict choices for the other flavor. (F) Cross-animal choice prediction. For each animal pair, we used one monkey’s nutrient–value function to predict the other monkey’s choices. We defined a PDI based on the average log-likelihood ratio of mutual cross-animal predictions (shown as numbers in the triangle plot). Longer triangle side-lengths represent larger discrepancies between animals’ nutrient preferences. (G) Fat–sugar contributions in explaining individual differences. Percentage increases in PDIs after independently including fat or sugar regressors into the basic regression for pair-wise cross-animal predictions.

