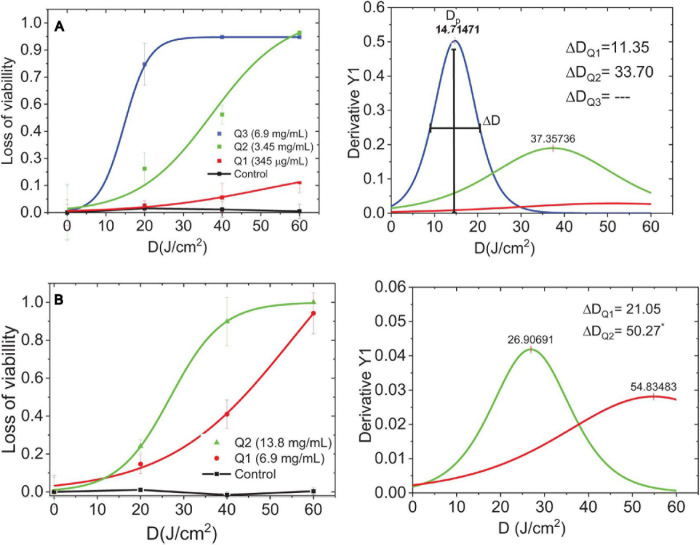
FIGURE 7.
Dose-response curves and threshold dose distribution. (A) Planktonic S. aureus + C-DOTS. (B) Biofilm of S. aureus + C-DOTS. Dp is the maximum dose of delivery light, ΔD [full-width half-maximum (FWHM)] is the threshold dose distribution curves obtained from the dose–response curves. *The FWHM value found of the complete curve.

