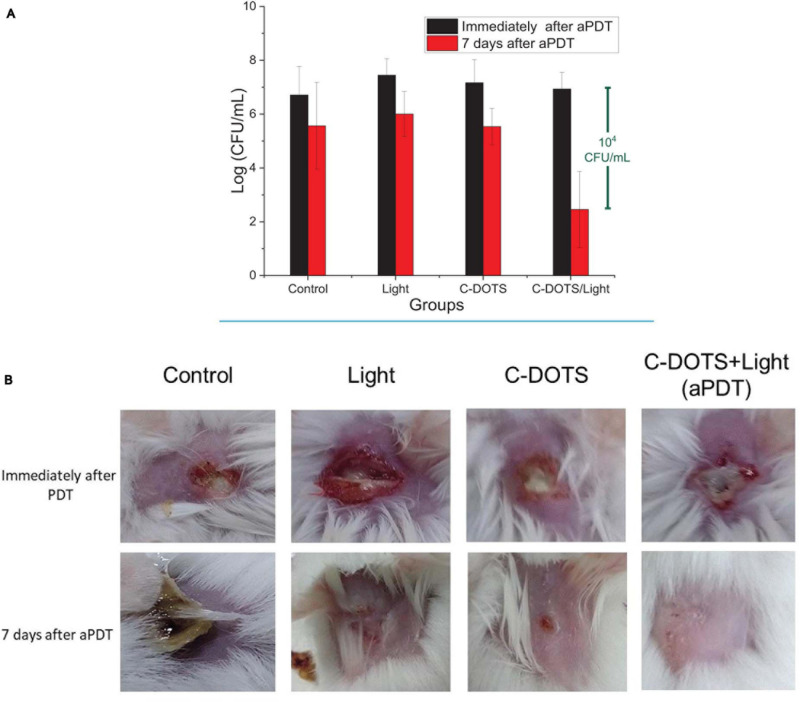
FIGURE 8.
In vivo aPDT. (A) Log (CFU/mL) of S. aureus bacteria in mouse immediately aPDT (black blocks) and 7 days after the procedures (red blocks) in control, light, C-DOTS, and C-DOTS + light (aPDT) groups (n = 3). (B) Photographs of mice wounds infected with S. aureus. Same groups as panel (A) (n = 3). The C-DOTS concentration was 6.9 mg/mL; the wound was infected with 108 cells/mL of bacteria suspension; the LED light was applied with the dose of 60 J/cm2 (28 min) at 450 nm.

