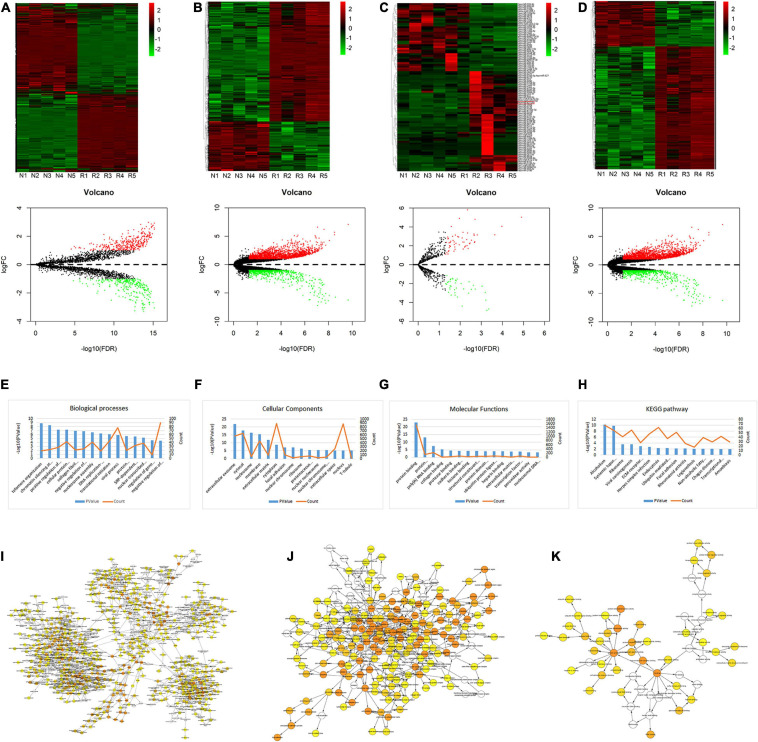
FIGURE 1.
Heat map, volcano plots, GO annotation, and KEGG analysis of DEGs. (A–D) Heat map and volcano plots of circRNAs (A), lncRNAs (B), miRNAs (C), and mRNAs (D). The upper heat maps are based on expression values of significantly differentially expressed ncRNAs and mRNAs (absolute fold change ≥ 2.0 and p < 0.05) detected by microarray probes. “Red” and “Green” indicate expression above and below, respectively, relative expression. R = IDD group; N = control group. The bottom volcano plots reflect the number, significance, and reliability of differentially expressed ncRNAs and mRNAs. Red dots are up-regulated genes, green dots are down-regulated genes, and black dots are genes that were the same between the two groups. (E–H) GO annotation and KEGG analysis of differentially expressed mRNAs, with the top 15 enrichment scores covering domains of biological processes (E), cellular components (F), molecular functions (G), and significant pathways (H). Enrichment score values were calculated as –log 10 (p-values). (I–K) The BP (I), CC (J), and MF (K) were visualized in Cytoscape.

