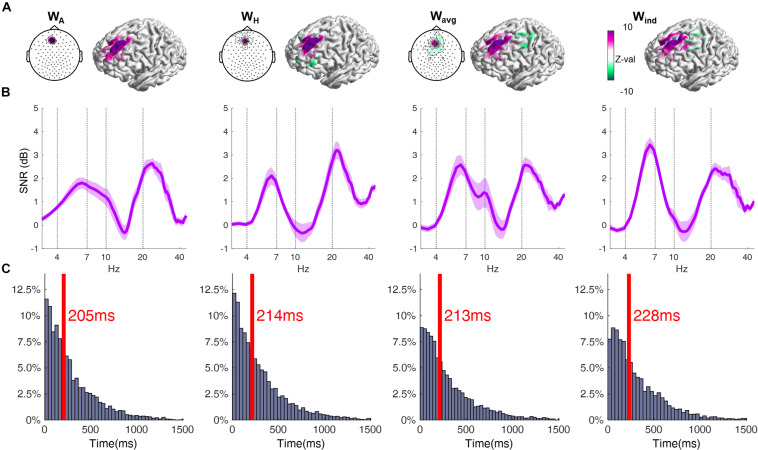
FIGURE 2.
(A) Topographical plot displaying the EEG channels’ coefficient weighs of the respective filter. Cortical surface plots show the sensitivity profile of the respective filter, averaged across all subjects. The coefficient weights are given in arbitrary units, and are here normalized across all individuals using the standard score (z-value). Note that for the Wind filter the values are different for each subject, and its average is depicted in Wavg. Also, results using the Wind filter involved the application of the individual filter for each subject, and thus cannot be shown as a single topographical plot. (B) Power spectra of the resting-state EEG signal, obtained by using the respective spatial filters, averaged across all subjects (shaded area corresponds to ± 1 SEM). Data is depicted in form of Signal-to-Noise-Ratio. (ANOVA, p = 0.0055; post-hoc WA = WH < Wind). (C) Distribution of the time lengths of epochs between phase slip events of the theta oscillation. Red line and text indicate the median of the respective distribution (ANOVA, p = 0.0009; post-hoc WA < WH = Wavg < Wind).

