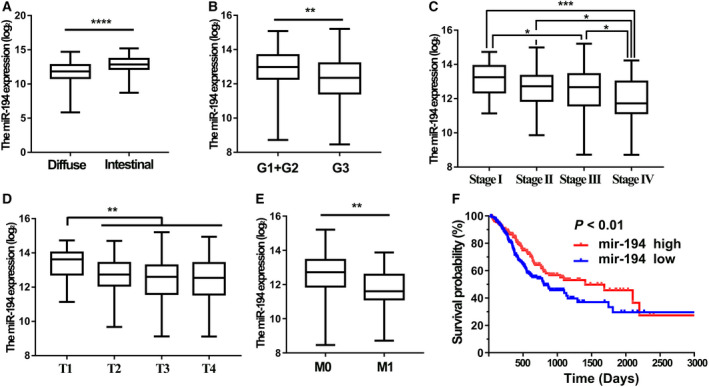
Fig. 2.

The correlations between miR‐194 expression level and clinicopathological features of the GC patients from TCGA. (A) Difference in expression levels of miR‐194 between intestinal and diffuse GC tissues; (B–E) the expression level of miR‐194 in different differentiation grade; (B) pathological stages (C), T stages (D), and M stages (E) of GC tissues from TCGA (n = 373); and (F) the Kaplan–Meier analysis of the overall survival time differences between GC patients with relative higher miR‐194 expression and GC patients with relative lower miR‐194 expression. The P values were estimated using the Mann–Whitney nonparametric test (*P < 0.05, **P < 0.01, ***P < 0.001).
