
Fig. 1.
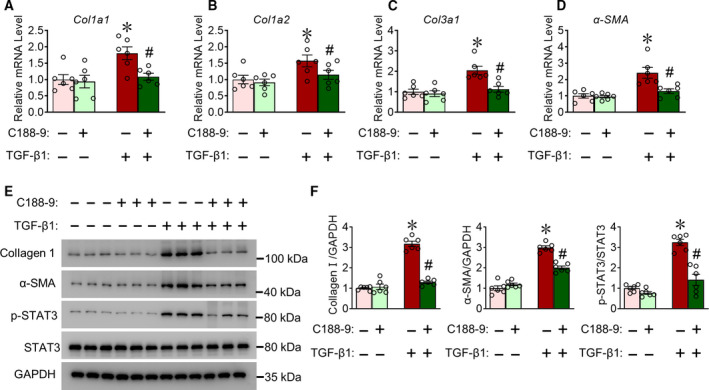
C188‐9 reduces TGF‐β1‐induced fibroblast activation. CFs were isolated, pretreated with C188‐9 (10 μm) for 12 h, and then stimulated with C188‐9 and TGF‐β1 for another 48 h. Total RNA or protein extracts were isolated. (A–D) Quantitative RT‐PCR (qRT‐PCR) of Col1a1 (A), Col1a2 (B), Col3a1 (C), and α‐SMA (D) transcript levels in CFs. Results are normalized to 1, n = 6, *P < 0.05, TGF‐β1‐DMSO vs. vehicle DMSO. # P < 0.05, TGF‐β1‐C188‐9 vs. TGFβ1‐DMSO; two‐way ANOVA, followed by Tukey's post hoc test. (E) Western blots of collagen Ⅰ, α‐SMA, p‐STAT3, and total STAT3 levels. GAPDH was used as loading control. (F) Quantification of relative collagen I and α‐SMA levels. n = 6. *P < 0.05, TGF‐β1‐DMSO vs. vehicle DMSO. # P < 0.05, TGF‐β1‐C188‐9 vs. TGFβ1‐DMSO; two‐way ANOVA, followed by Tukey's post hoc test. Data are presented as mean ± SEM.