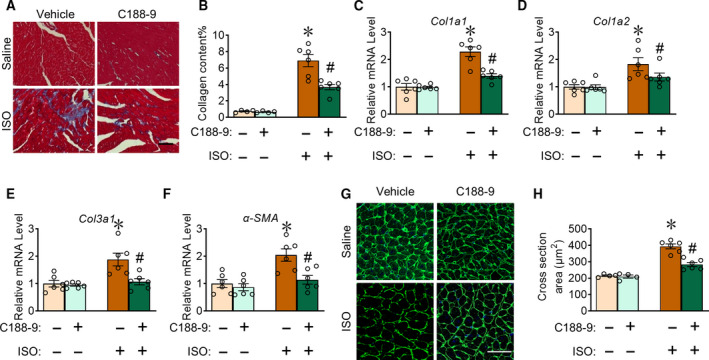
Fig. 3.

C188‐9 treatment suppresses ISO‐induced fibrosis and hypertrophy in mice. (A, B) Representative images (A) and quantification (B) of Masson's trichrome staining in heart sections from saline‐ or ISO‐treated mice. Saline group, n = 4; ISO group, n = 6; *P < 0.05, ISO‐vehicle vs. saline‐vehicle. # P < 0.05, ISO‐C188‐9 vs. ISO‐vehicle. Scale bar: 50 μm. (C–F) qRT‐PCR of Col1a1 (C), Col1a2 (D), Col3a1 (E), and α‐SMA (F) in mouse heart tissues. n = 6. *P < 0.05, ISO‐vehicle vs saline‐vehicle. # P < 0.05, ISO‐C188‐9 vs. ISO‐vehicle. (G, H) Representative images (G) and quantification (H) of WGA staining in heart cross sections from saline‐ or ISO‐treated mice. Saline group, n = 4; ISO group, n = 6; *P < 0.05, ISO‐vehicle vs. saline‐vehicle. # P < 0.05, ISO‐C188‐9 vs. ISO‐vehicle. Scale bar: 50 μm. Two‐way ANOVA, followed by Tukey's post hoc test. Data are presented as mean ± SEM.
