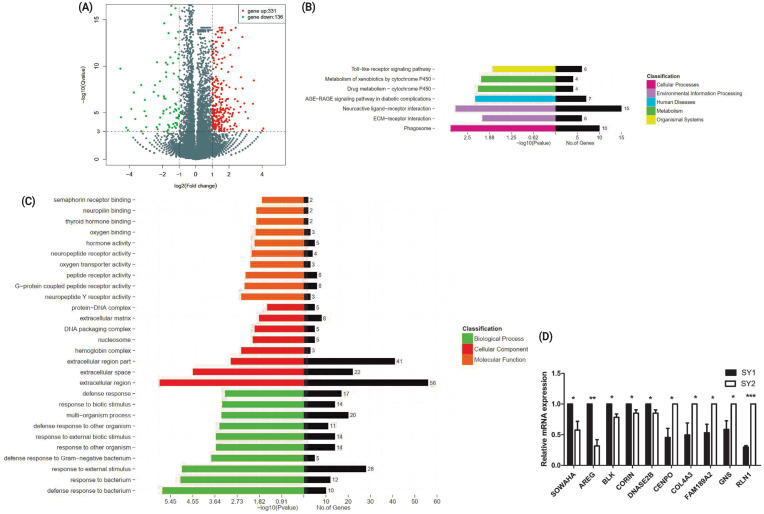
Figure 1.
The DEGs between two small yellow follicles differing in FSHR expression in chickens. (A) Differentially expressed genes between samples. (B) The KEGG analysis diagram of the DEGs. (C) The GO analysis diagram of the DEGs. (D) Validation by qRT-PCR of 10 DEGs obtained by RNA-seq. SY1 represents small yellow follicles with higher FSHR expression. SY2 represents small yellow follicles with lower FSHR expression. DEGs, differentially expressed genes; FSHR, follicle stimulation hormone receptor; KEGG, Kyoto encyclopedia of genes and genomes; GO, gene ontology; qRT-PCR, real-time quantitative polymerase chain reaction; SY, small yellow.

