. 2021 Jun 30;7(2):257–270. doi: 10.3934/microbiol.2021016

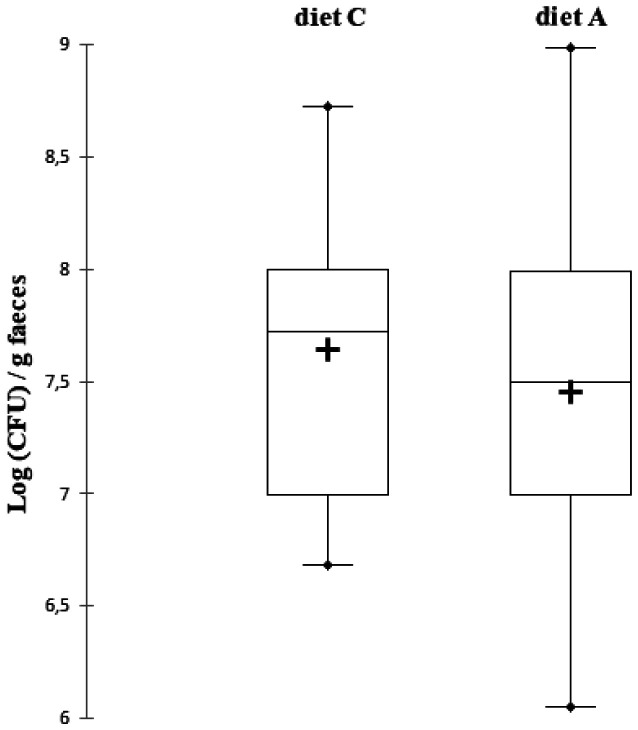
Figure 3. Box-plot representation of Lactobacillus spp. counts after the 7 days experimental period with two different diets in Wistar rats (n = 13). Diet C was a standard diet without polyphenols. Diet A was a standard diet supplemented with cranberry powder containing 10.9 mg/100 g of proanthocyanidin-type polyphenols. The middle region of each box plot (box body) covers 50% of the animals. The median values are presented in black lines inside the box bodies. The upper black dots present the maximum and the lower black dots present the minimum. The mean values are presented in crosses inside the box bodies. The significance of the diet effect was analysed with a signed Wilcoxon test for paired data.

Figure 3.