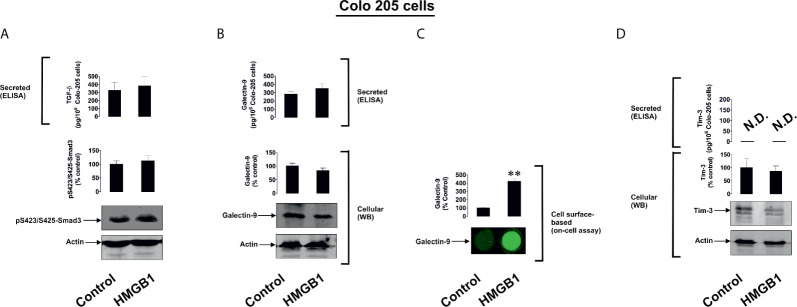
Figure 3.
The effects of HMGB1 on Galectin-9 and Tim-3 expression in Colo 205 human colorectal cancer cells. Colo 205 cells were exposed for 24 h to 1 µg/ml HMGB1 followed by measurement of TGF-β secretion and Smad3 activating phosphorylation (A), galectin-9 protein expression and secretion (B), galectin-9 cell surface presence (C) and Tim-3 protein expression and release (D). Images are from one experiment representative of four which gave similar results. Quantitative data are expressed as mean values ± SEM of four independent experiments. **p < 0.01 vs control. N.D. in this and other figures denotes “not detectable”.

