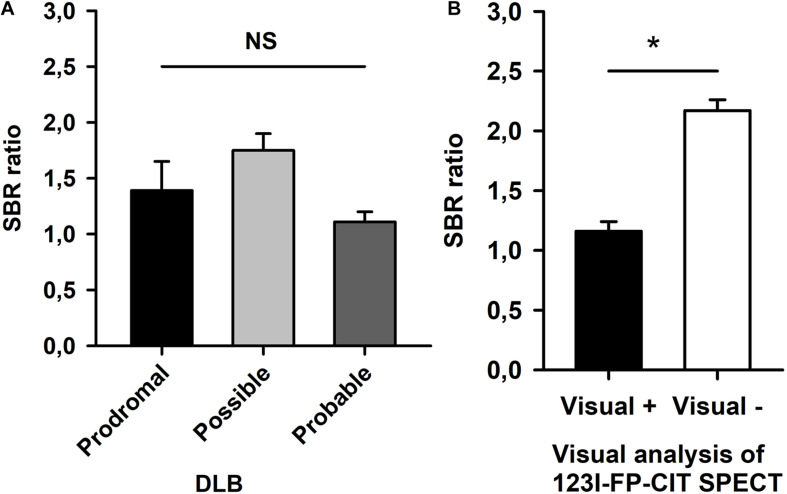
FIGURE 3.
Semiquantitative analysis of 123I-FP-CIT-SPECT. Striatum-to-background (SBR) ratios are shown of prodromal, possible, and probable DLB patients in (A). (B) Demonstrates significant different SBR ratios between patients with vs. those without a nigrostriatal deficit by visual analysis of 123I-FP-CIT-SPECT. ANOVA: *p < 0.05, n.s., non-significant.

