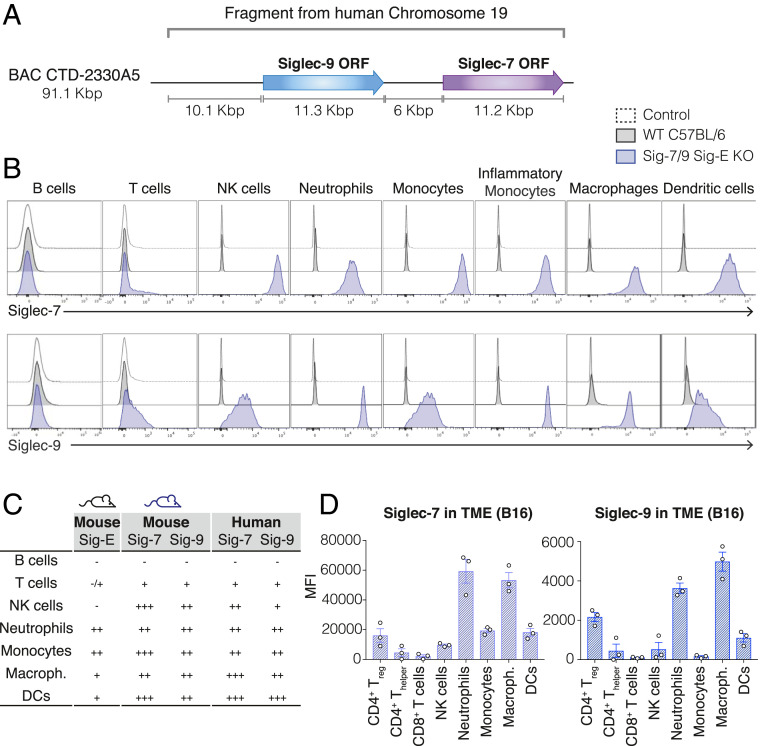
Fig. 2.
Characterization of the Siglec-7/9/Siglec-E KO mouse model. (A) Generation of the Siglec-7/9/Siglec-E KO mouse strain: A BAC DNA fragment that contains the ORF of Siglec-7 and Siglec-9 and their regulatory elements was inserted into the genome of WT C57BL/6 mice to generate a mouse line expressing human Siglec-7 and Siglec-9 (Siglec-7/9 mice). This mouse line was then crossed to Siglec-E KO mice to generate the humanized Siglec-7/9/Siglec-E KO mouse line. (B) Surface expression of Siglec-7 (Upper) or Siglec-9 (Lower) on immune populations of WT C57BL/6 mice (black) or Siglec-7/9/Siglec-E KO mice (blue), compared to an unstained control (dashed line). Panel shows a representative mouse (n > 9). (C) Table summarizes expression patterns of Siglecs: Siglec-E on WT C57BL/6 mice (first column), Siglec-7 and Siglec-9 on Siglec-7/9/Siglec-E KO mice (Center) and Siglec-7 and Siglec-9 on human PBMCs (Right) based on MFI. (−, no expression; +, MFI brighter than control and <104; ++, MFI between 104 and 105; +++, MFI brighter than 105). (D) Expression of Siglec-7 (Left) or Siglec-9 (Right) on immune populations infiltrated into B16 solid tumors inoculated to Siglec-7/9/Siglec-E KO mice. Graph shows MFI of Siglec-7 or Siglec-9 as indicated, each circle represents one mouse. Data are displayed as mean ± SEM. Panel shows a representative experiment (n = 2).

